5.1 Overview
5.1.1 Bulk ATAC-Seq
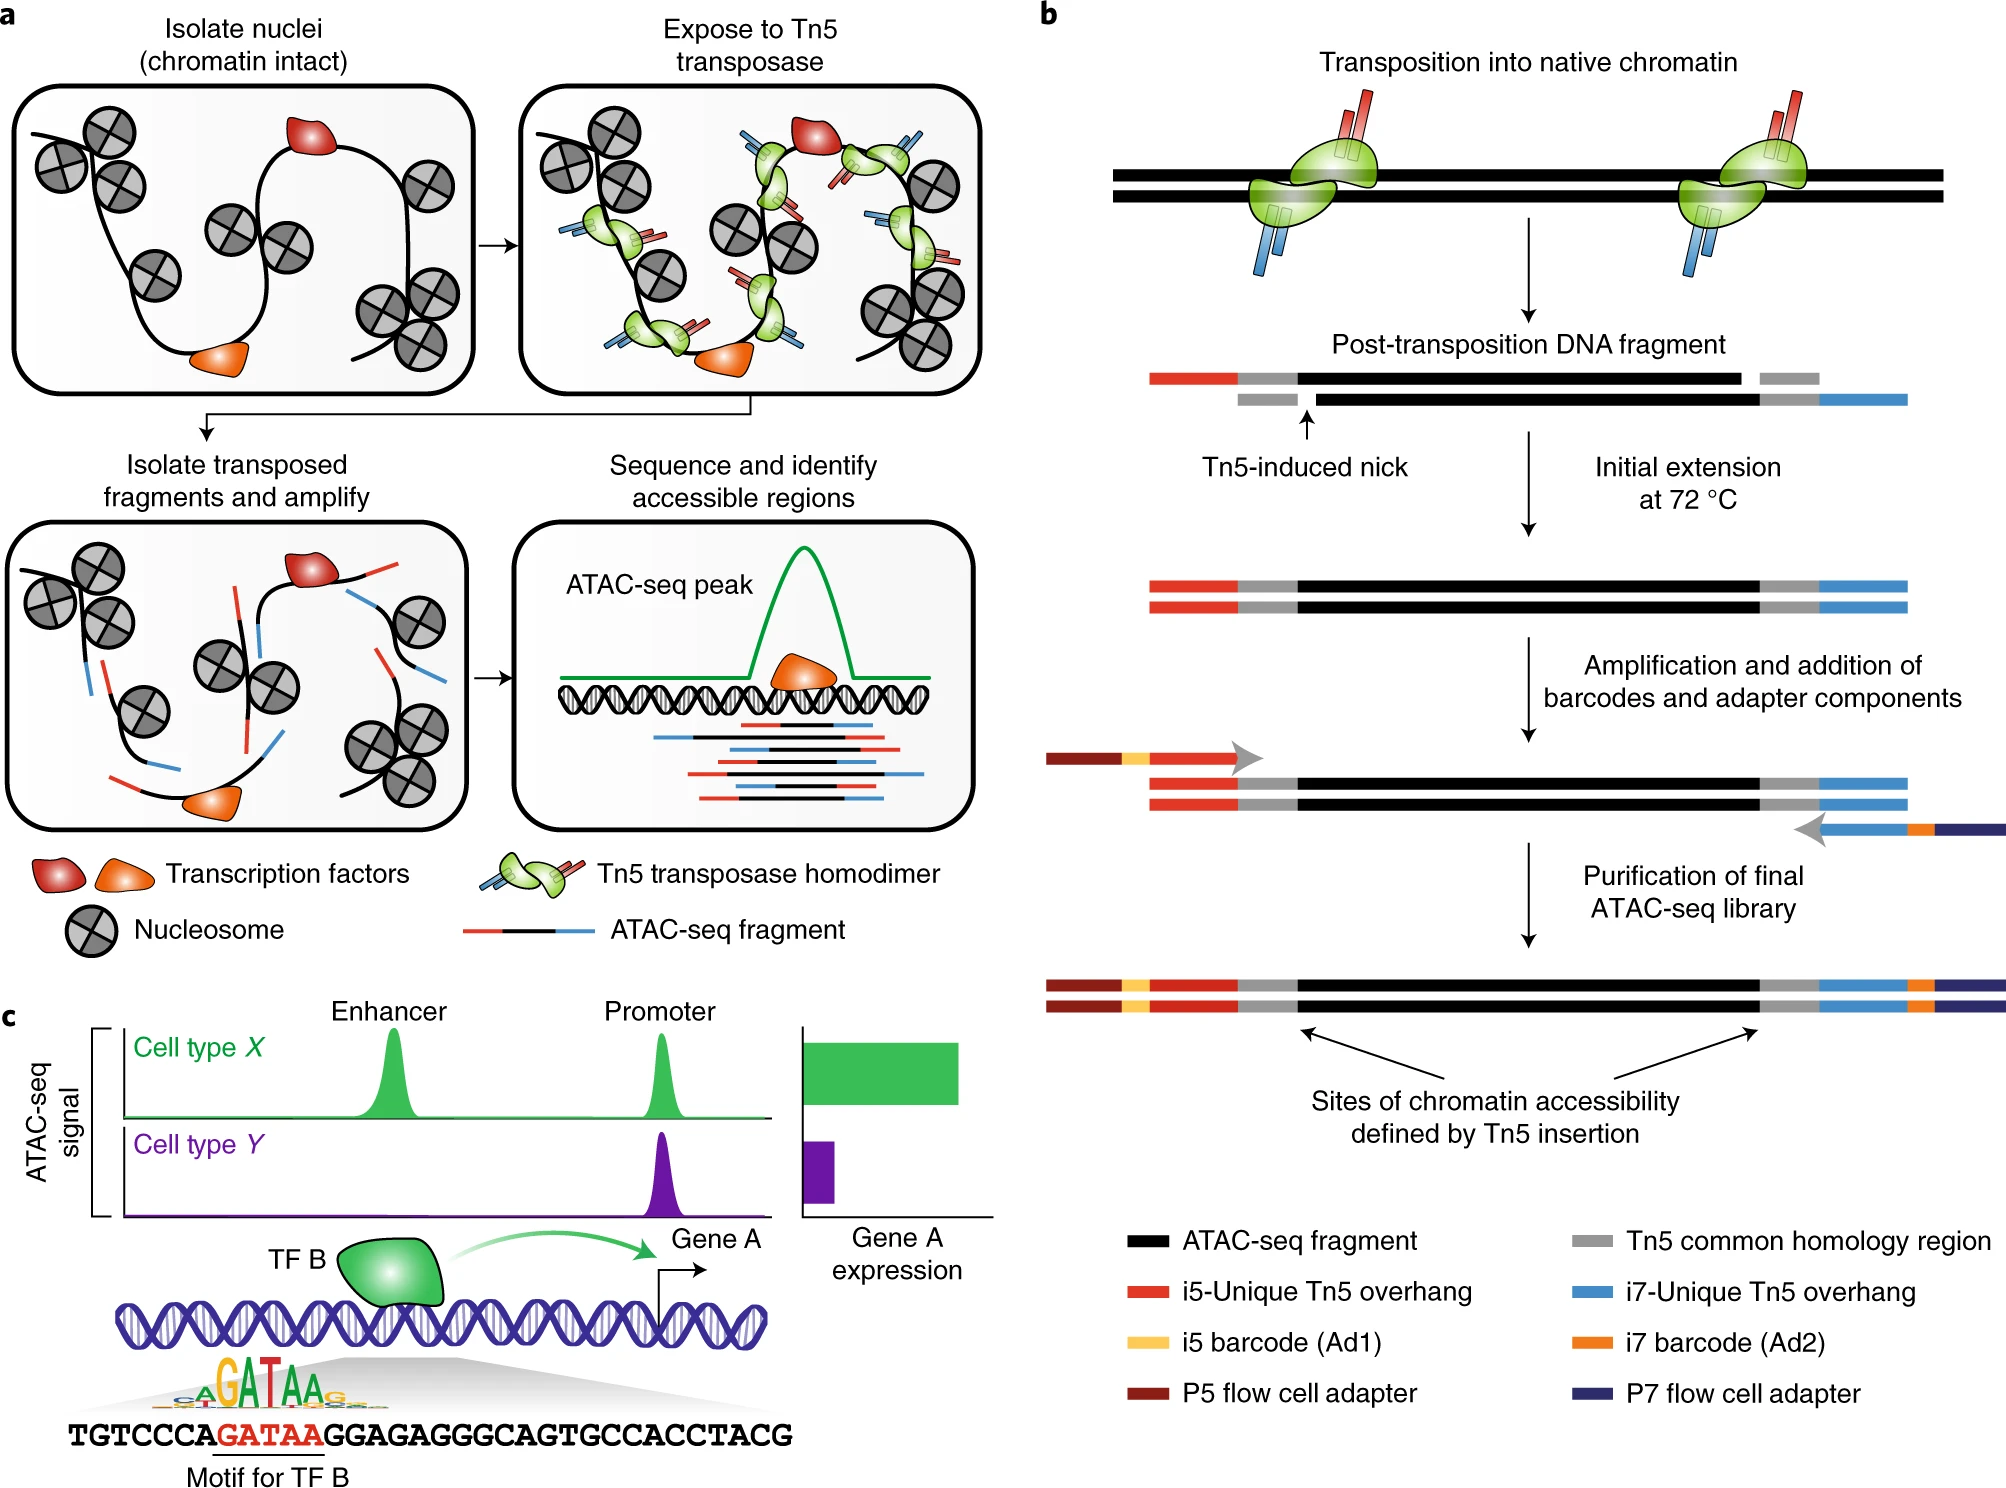
ATAC-seq provides a simple and scalable way to assay the regions of the genome that are bound by TFs, and to compare how these landscapes change between particular contexts or perturbations. This is accomplished using in vitro transposition of sequencing adapters into native chromatin. Each unique transposition event, termed an ‘insertion’, marks a location in the genome where a Tn5 transposase dimer is able to access DNA and perform a cut-and-paste reaction. The transposase simultaneously fragments the DNA and inserts sequence handles that are then used for amplification during library preparation.
5.1.2 Single-cell ATAC-Seq
- ATAC-Seq quantifies DNA and can be applied to frozen/fixed tisues where nuclei can be isolated
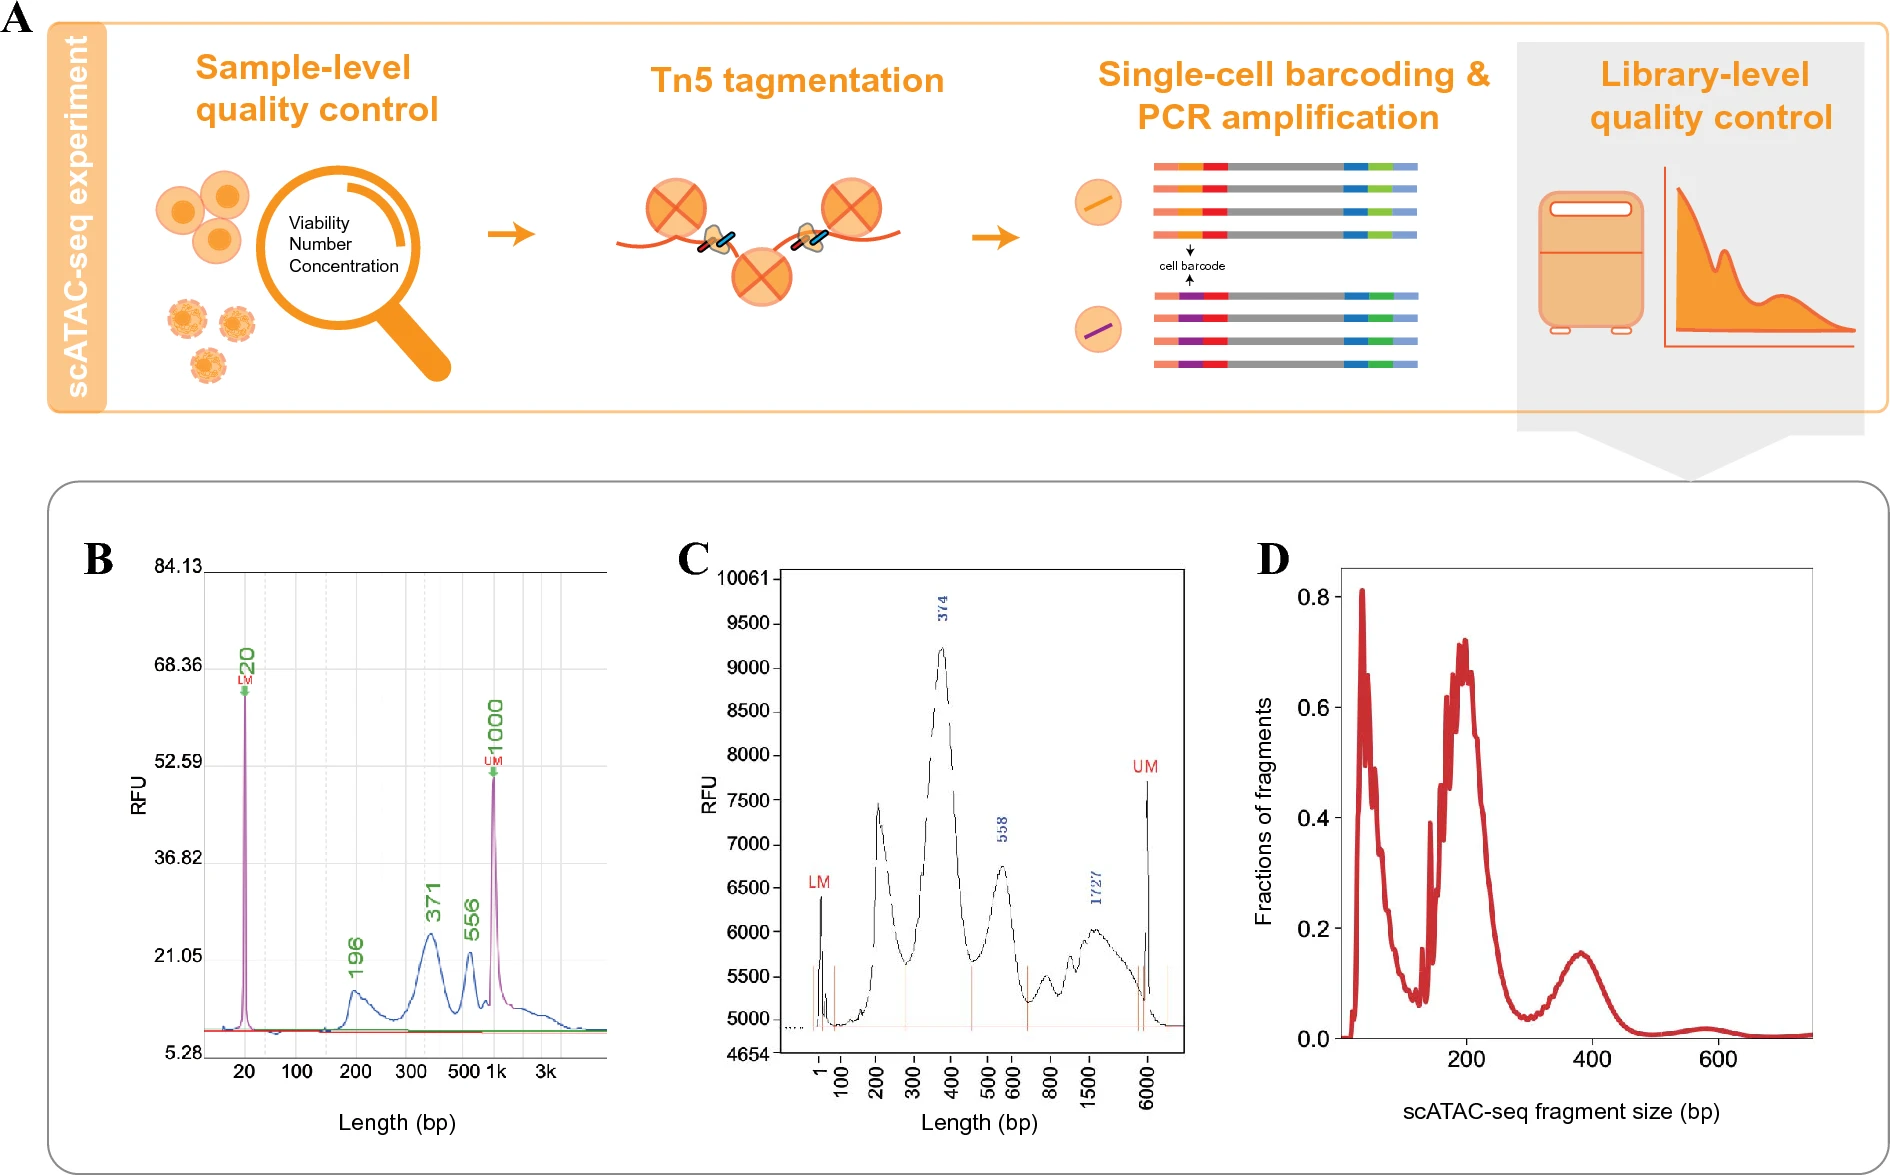
- Sample-level quality
- Cell viability must exceed 80%
- Accurate assessment of cell number
- Library-level quality
- DNA fragment distribution (multiples of 200bp)
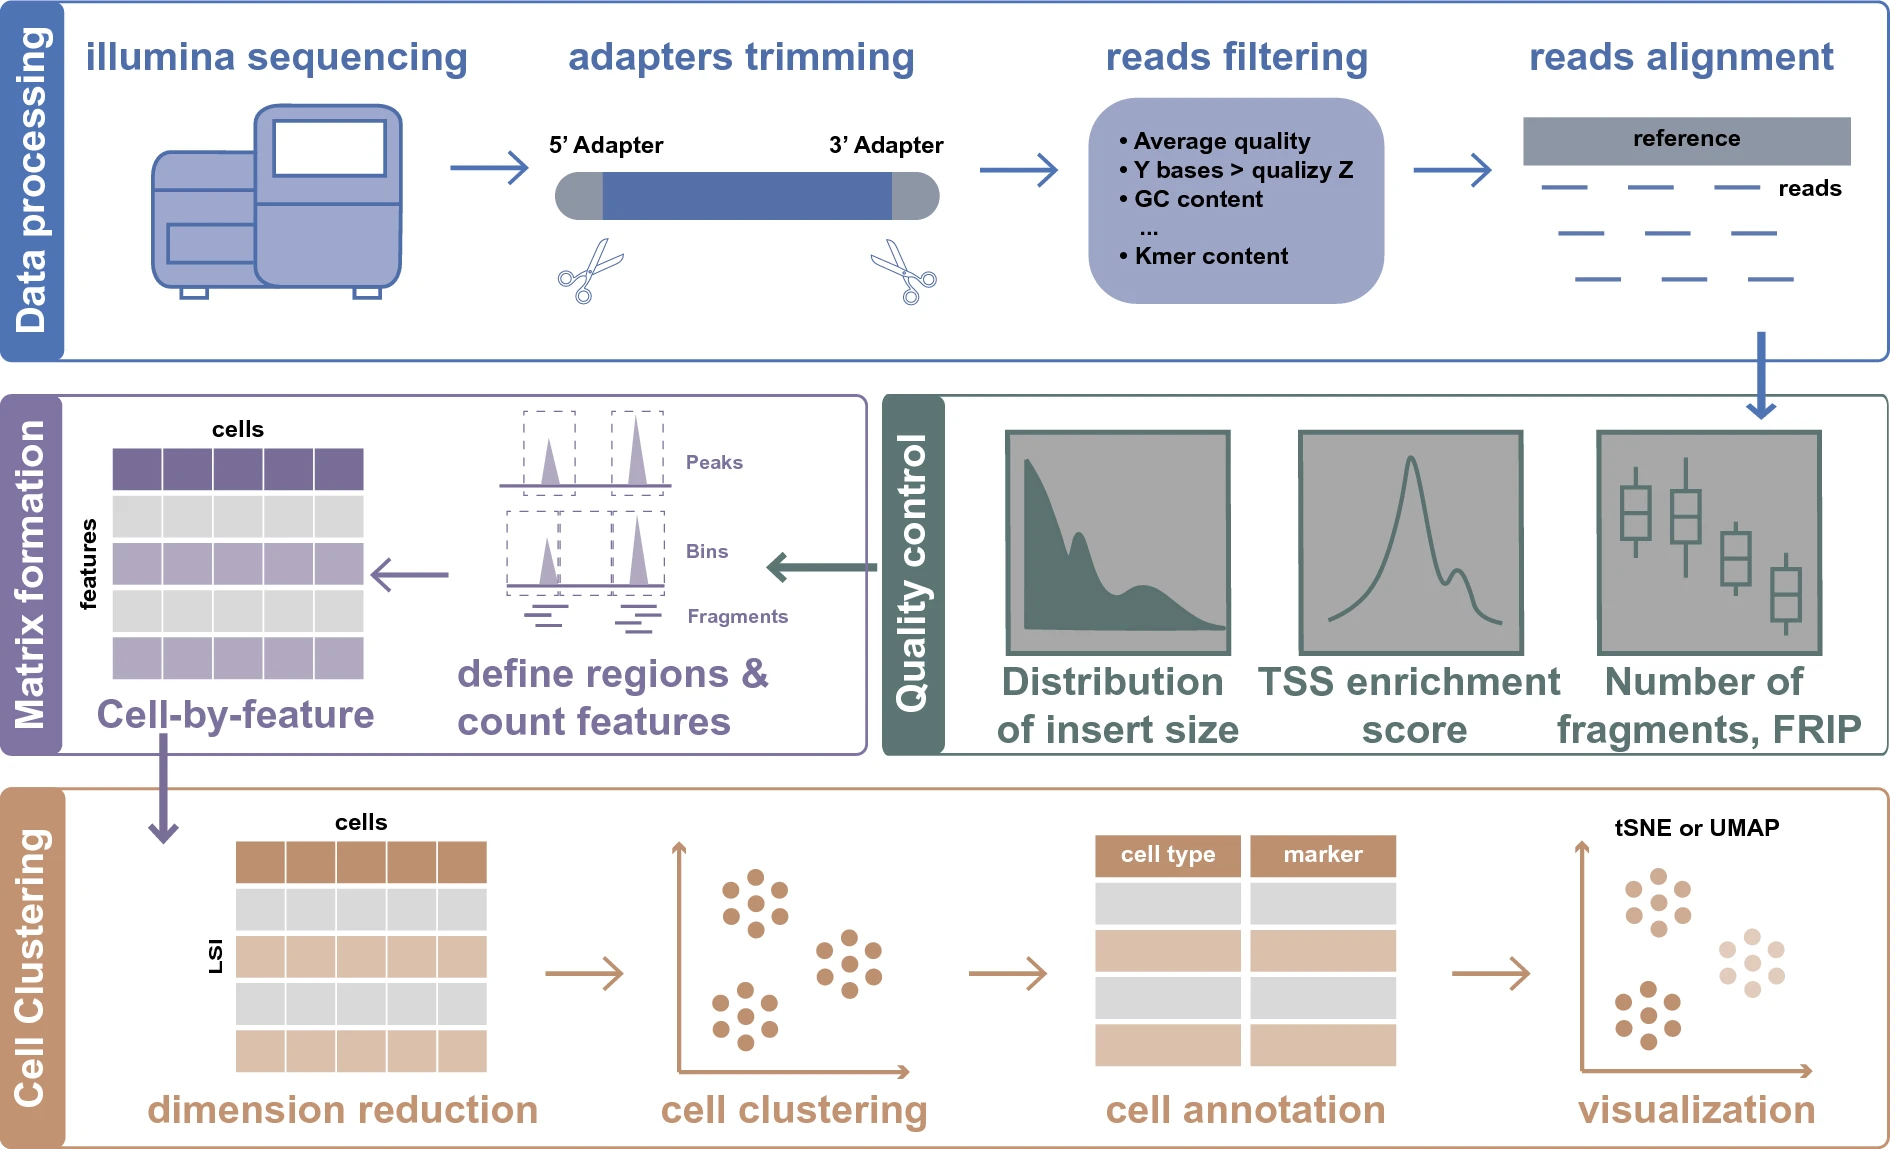
- Counts QC
- Unique nuclear fragments (>1000)
- Fraction of transposition events in the peaks (>0.3)
- Transcription start sites (TSS) enrichment score (>5)
- Ratio of mononucleosomal to nucleosome-free fragments
- Apply filters separately for each sample
- Generate features (peaks/target regions)
- Various methods exist
- Dimensionality reduction
- Cells with similar accessibility profiles are organized into clusters
- There are two approaches to cell identity annotation: the cell type-specific peaks-based method and the scRNA-seq-based method
- Enhancers can be used to accurately annotate cell types as distal cis-regulatory elements specific to particular cell types and states.
- Cell type-specific gene expression is predicted based on their accessibility and used to annotate cells
- Cell type-specific chromatin architecture
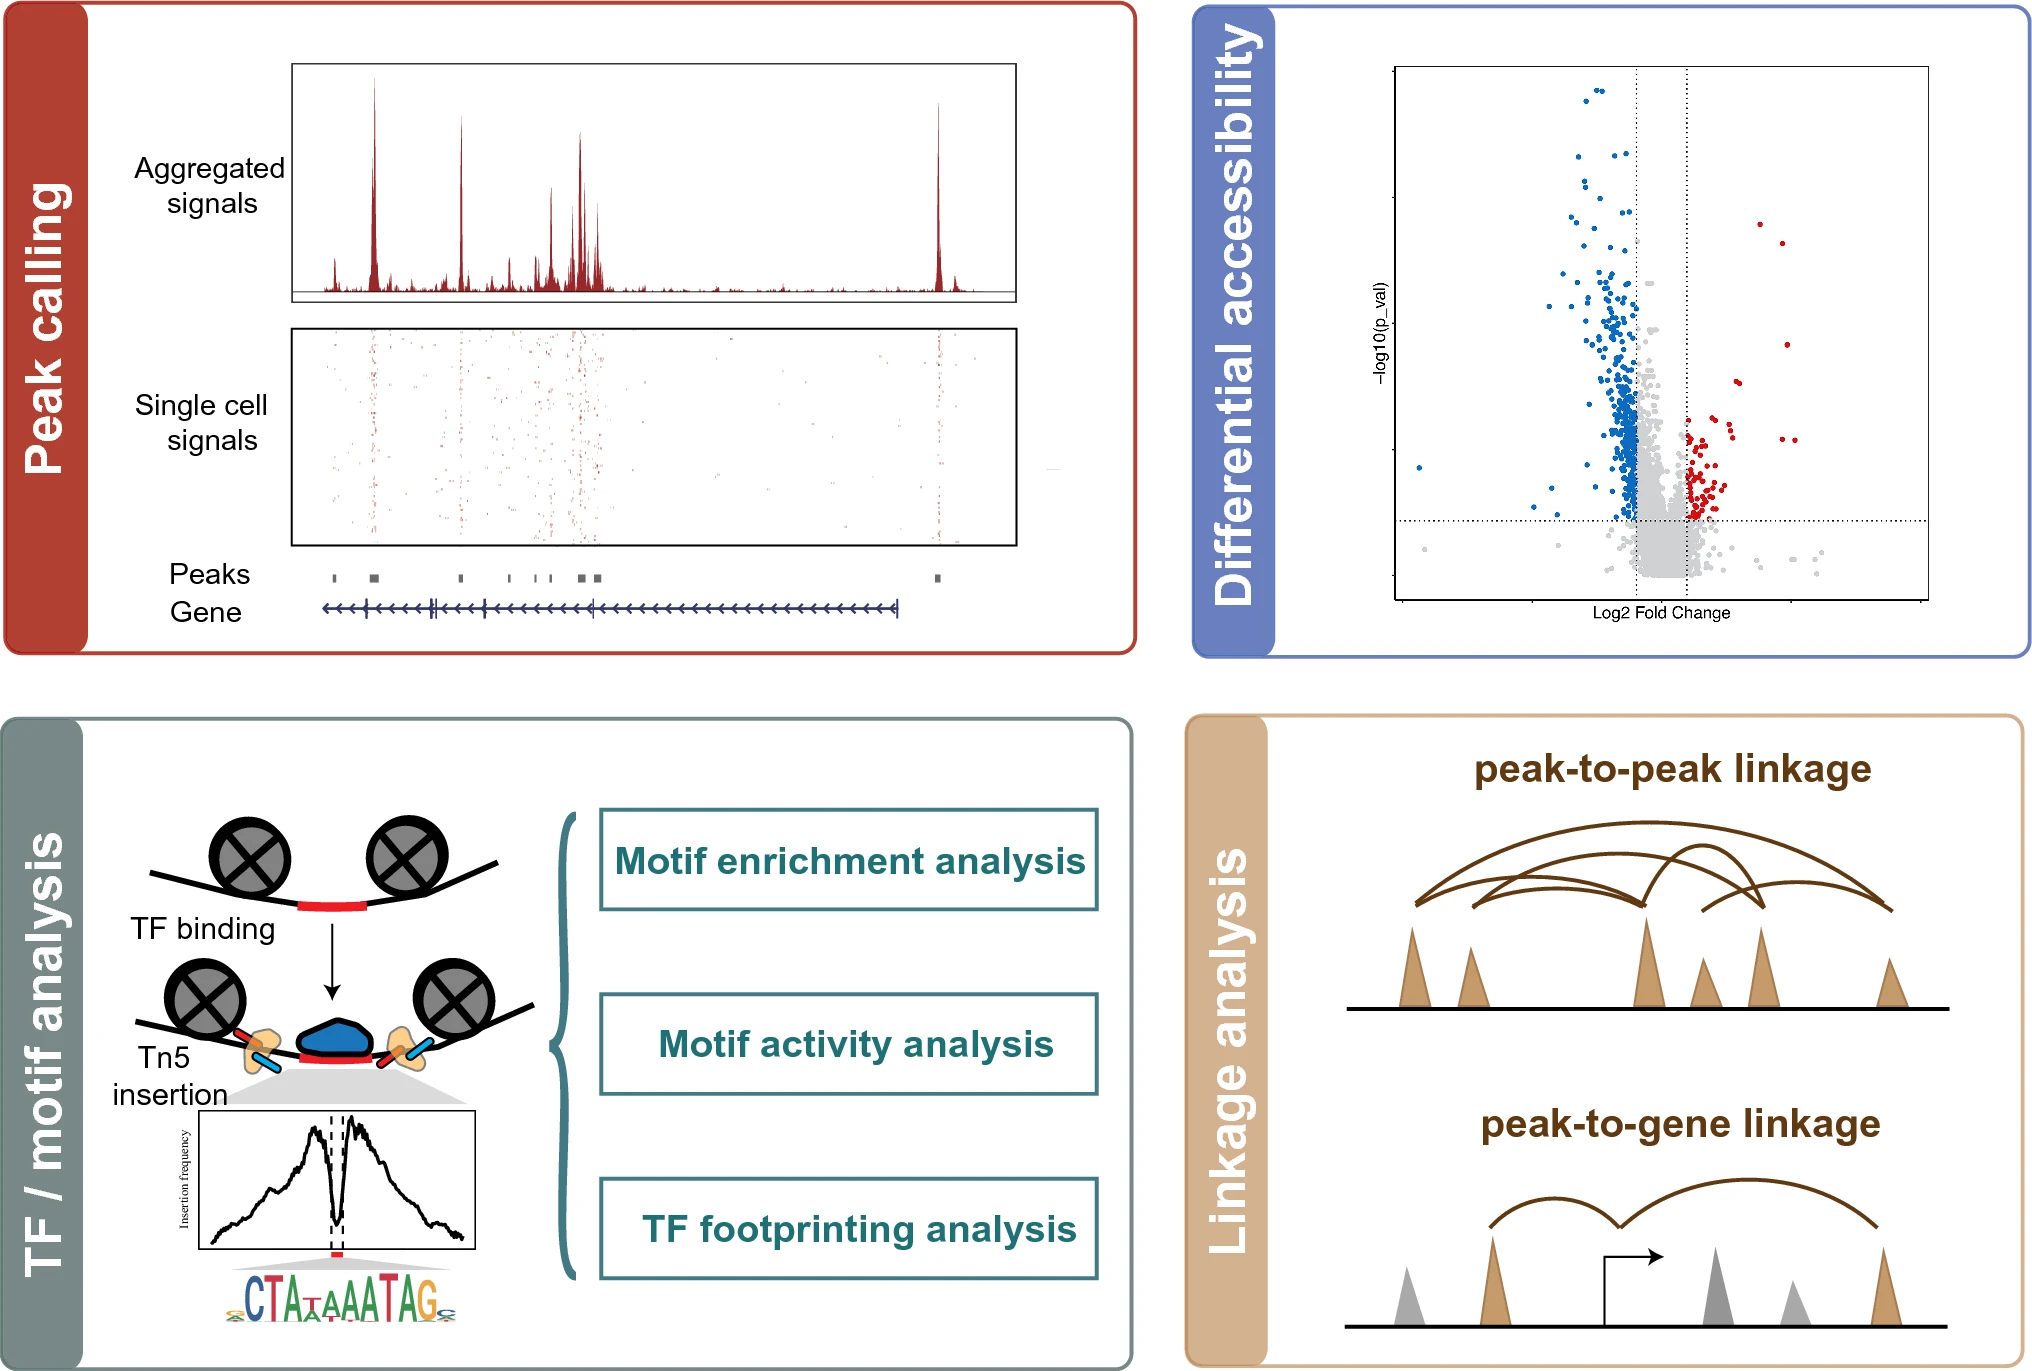
- Profiling the regulatory elements for each cluster/cell type
- Identifying differentially accessible regions between different clusters/cell types
- Uncovering key factors that contribute to the altered chromatin accessibility
- Linking promoter–enhancer interactions
- Three main strategies are used to identify TFs of interest
- Searching for overrepresented motifs in cell type-specific accessible regions
- Comparing motif activity between cell types
- Detecting foot-printing for TF occupancy
Shi et al. (2022)
Single-cell ATAC sequencing analysis: From data preprocessing to hypothesis generation
Baek & Lee (2020)
5.2 Feature selection
The performance of various methods for analyzing datasets with different cell structures and sizes is discussed. For simple datasets with distinct cell types, all methods are effective. For datasets with small cell classes or with hierarchical clustering and similar subtypes, SnapATAC and SnapATAC2 are preferred. SnapATAC is not memory-efficient for large datasets (over 20,000 cells); in such cases, SnapATAC2 is better. Signac outperforms ArchR, but ArchR is more memory-efficient. Adding aggregation steps to Signac does not significantly increase time or memory usage. Feature engineering choices like peak versus bins calling do not majorly affect performance, so users can choose based on preference. Recommended latent space dimensions vary by method: 10-30 for SnapATAC/SnapATAC2, 10-50 for Signac/ArchR, and even larger for aggregation methods.
De Rop et al. (2024)
5.3 Celltyping
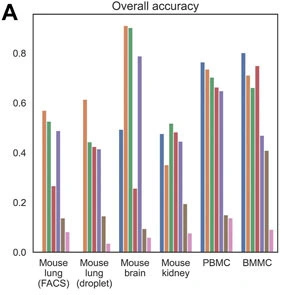
Here, we evaluated the performance of five scATAC-seq annotation methods on both their classification accuracy and scalability using publicly available single-cell datasets from mouse and human tissues including brain, lung, kidney, PBMC, and BMMC. Using the BMMC data as basis, we further investigated the performance of these methods across different data sizes, mislabeling rates, sequencing depths and the number of cell types unique to scATAC-seq. Bridge integration, which is the only method that requires additional multimodal data and does not need gene activity calculation, was overall the best method and robust to changes in data size, mislabeling rate and sequencing depth. Conos was the most time and memory efficient method but performed the worst in terms of prediction accuracy. scJoint tended to assign cells to similar cell types and performed relatively poorly for complex datasets with deep annotations but performed better for datasets only with major label annotations. The performance of scGCN and Seurat v3 was moderate, but scGCN was the most time-consuming method and had the most similar performance to random classifiers for cell types unique to scATAC-seq.
Wang et al. (2022)
5.4 Benchmarking tools
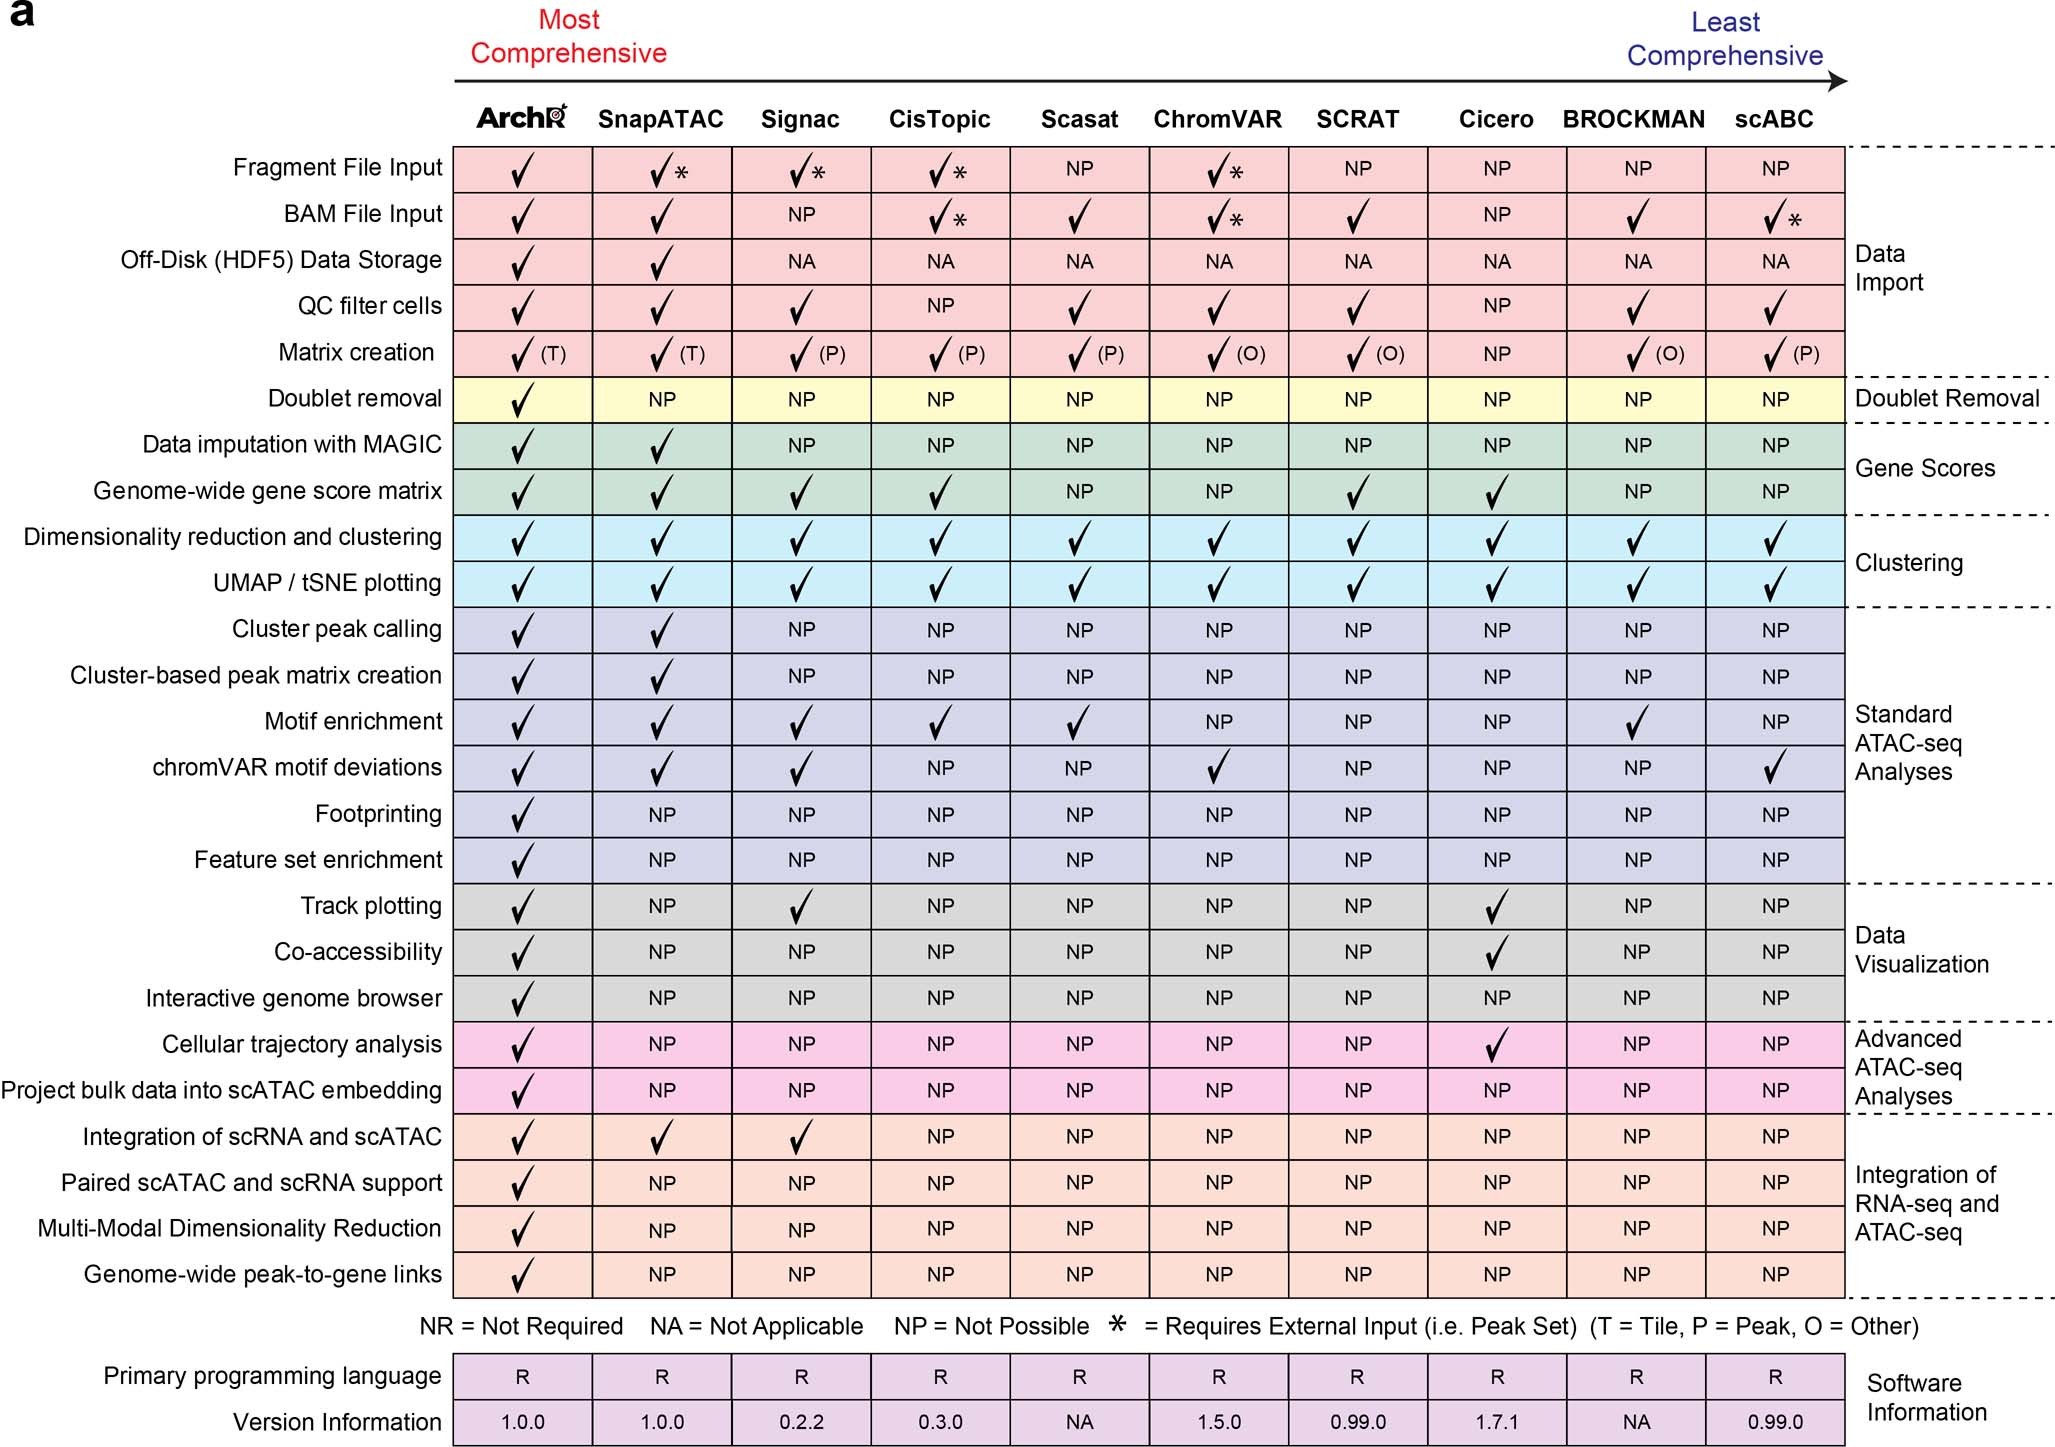
Our benchmarking results highlight SnapATAC, cisTopic, and Cusanovich2018 as the top performing scATAC-seq data analysis methods to perform clustering across all datasets and different metrics. Methods that preserve information at the peak level (cisTopic, Cusanovich2018, Scasat) or bin level (SnapATAC) generally outperform those that summarize accessible chromatin regions at the motif/k-mer level (chromVAR, BROCKMAN, SCRAT) or over the gene body (Cicero, Gene Scoring). In addition, methods that implement a dimensionality reduction step (BROCKMAN, cisTopic, Cusanovich2018, Scasat, SnapATAC) generally show advantages over the other methods without this important step. SnapATAC is the most scalable method; it was the only method capable of processing more than 80,000 cells. Cusanovich2018 is the method that best balances analysis performance and running time.
Chen et al. (2019)
Overall, feature aggregation, SnapATAC, and SnapATAC2 outperform latent semantic indexing-based methods. For datasets with complex cell-type structures, SnapATAC and SnapATAC2 are preferred. With large datasets, SnapATAC2 and ArchR are most scalable.
Luo et al. (2024)
5.5 Tools
 Granja et al. (2021)