Loading required package: sysfontsLoading required package: showtextdbLoading required package: sysfontsLoading required package: showtextdbImport fonts and enable showtext once per session.
plummy::import_barlow()
plummy::import_inter()
plummy::import_plex()
plummy::import_nunito()
plummy::import_lato()

# list available fonts
# sysfonts::font_families()
The showtext package is used to render the fonts on graphics devices. To automatically handle font rendering, set showtext::showtext_auto(). When exporting plots, set showtext_opts(dpi = 300). In Rmd/quarto documents, set:
knitr:
  opts_knit:
    fig.showtext: true
# enable showtext for interactive use
showtext::showtext_auto()
# for exporting, set dpi
# showtext_opts(dpi = 300)Let’s create some sample plots.
p1 <- ggplot(iris, aes(Sepal.Length, Sepal.Width)) +
  geom_point() +
  labs(
    title = "Iris dataset",
    subtitle = "Comparison of iris species",
    x = "Sepal length",
    y = "Sepal width",
    caption = "Source: Edgar Anderson"
  )
p2 <- p1 + theme_minimal()
wrap_plots(p1, p2, ncol = 2)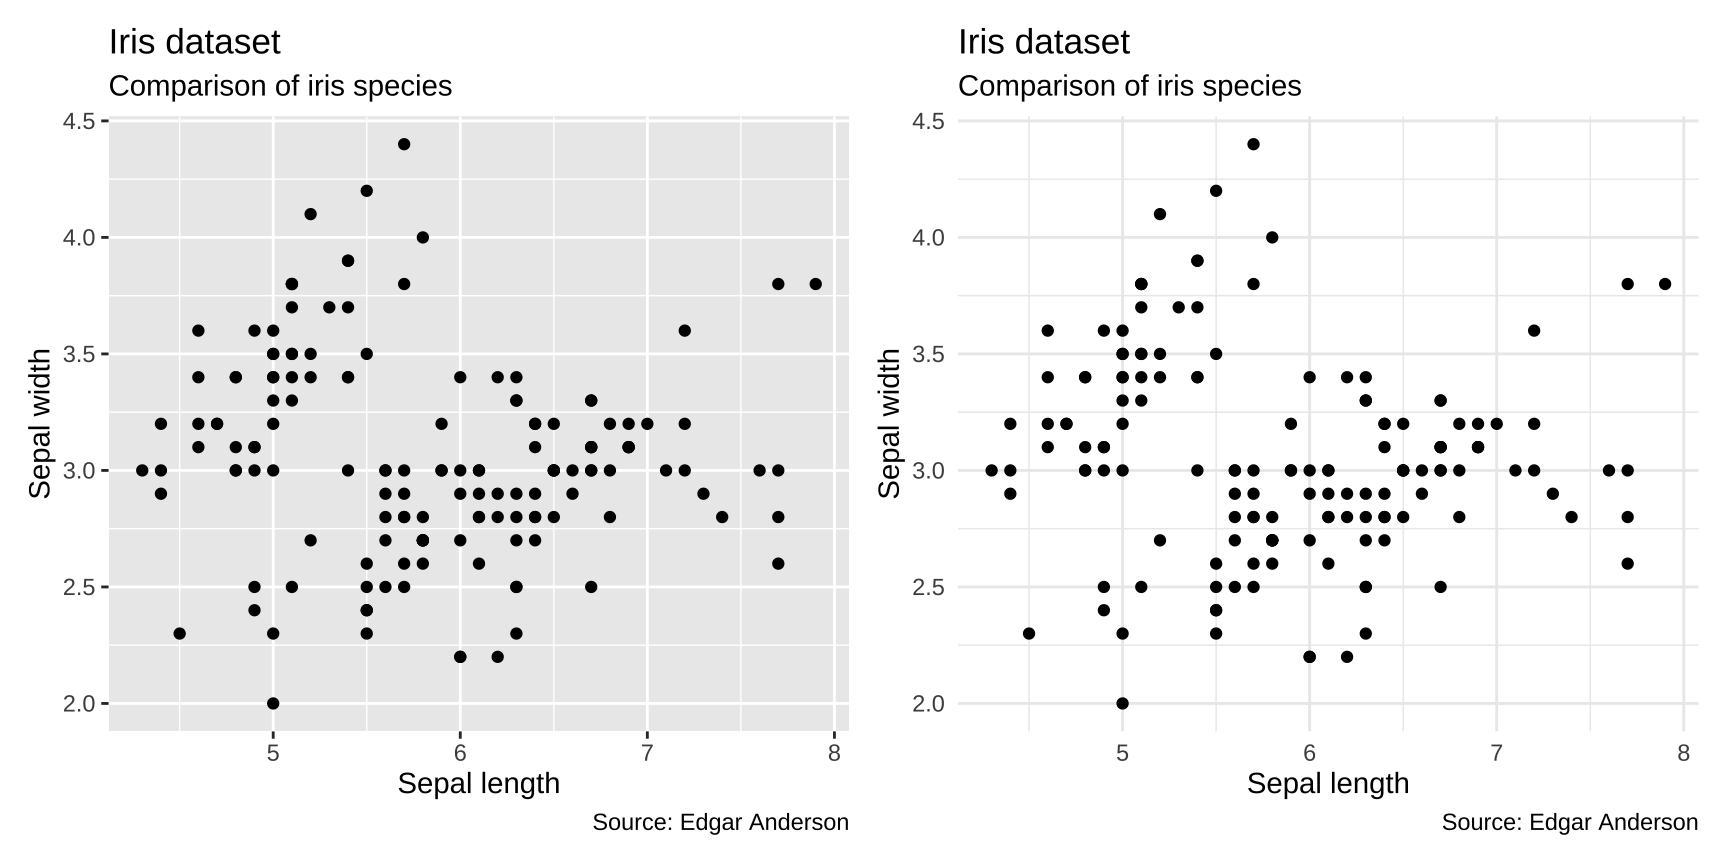
Now let’s try the plummy theme.
p3 <- p1 + plummy()
wrap_plots(p2, p3, ncol = 2)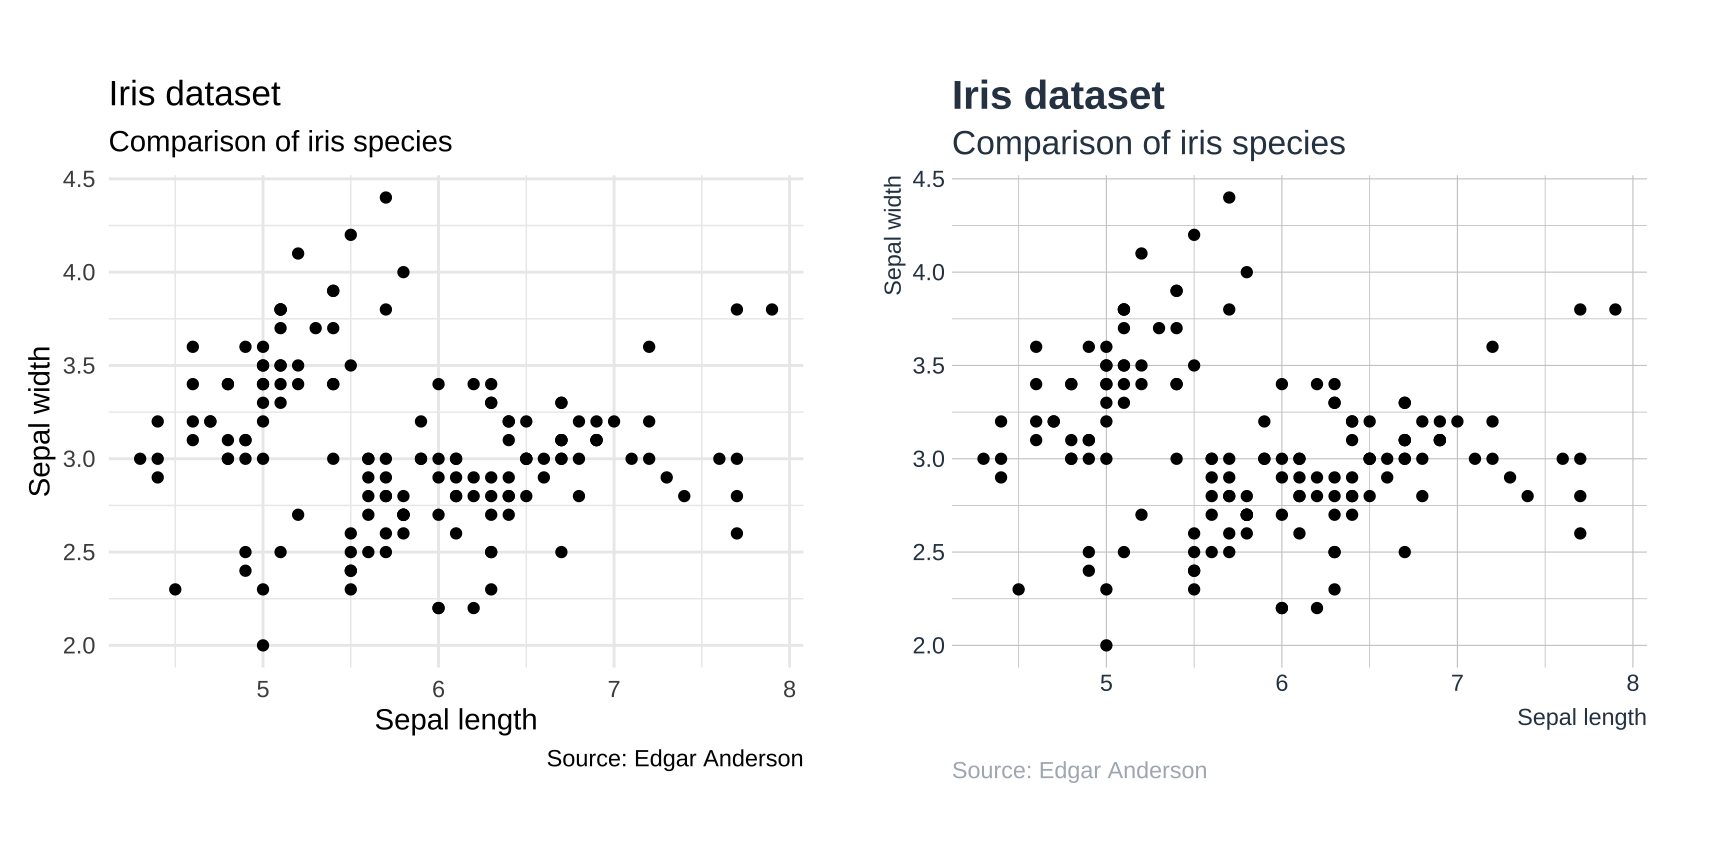
Now let’s try the plummy theme with custom fonts.
p2 <- p1 + plummy(family = "barlow")
p3 <- p1 + plummy(family = "inter")
p4 <- p1 + plummy(family = "plex")
p5 <- p1 + plummy(family = "nunito")

wrap_plots(p2, p3, p4, p5, nrow = 2, ncol = 2)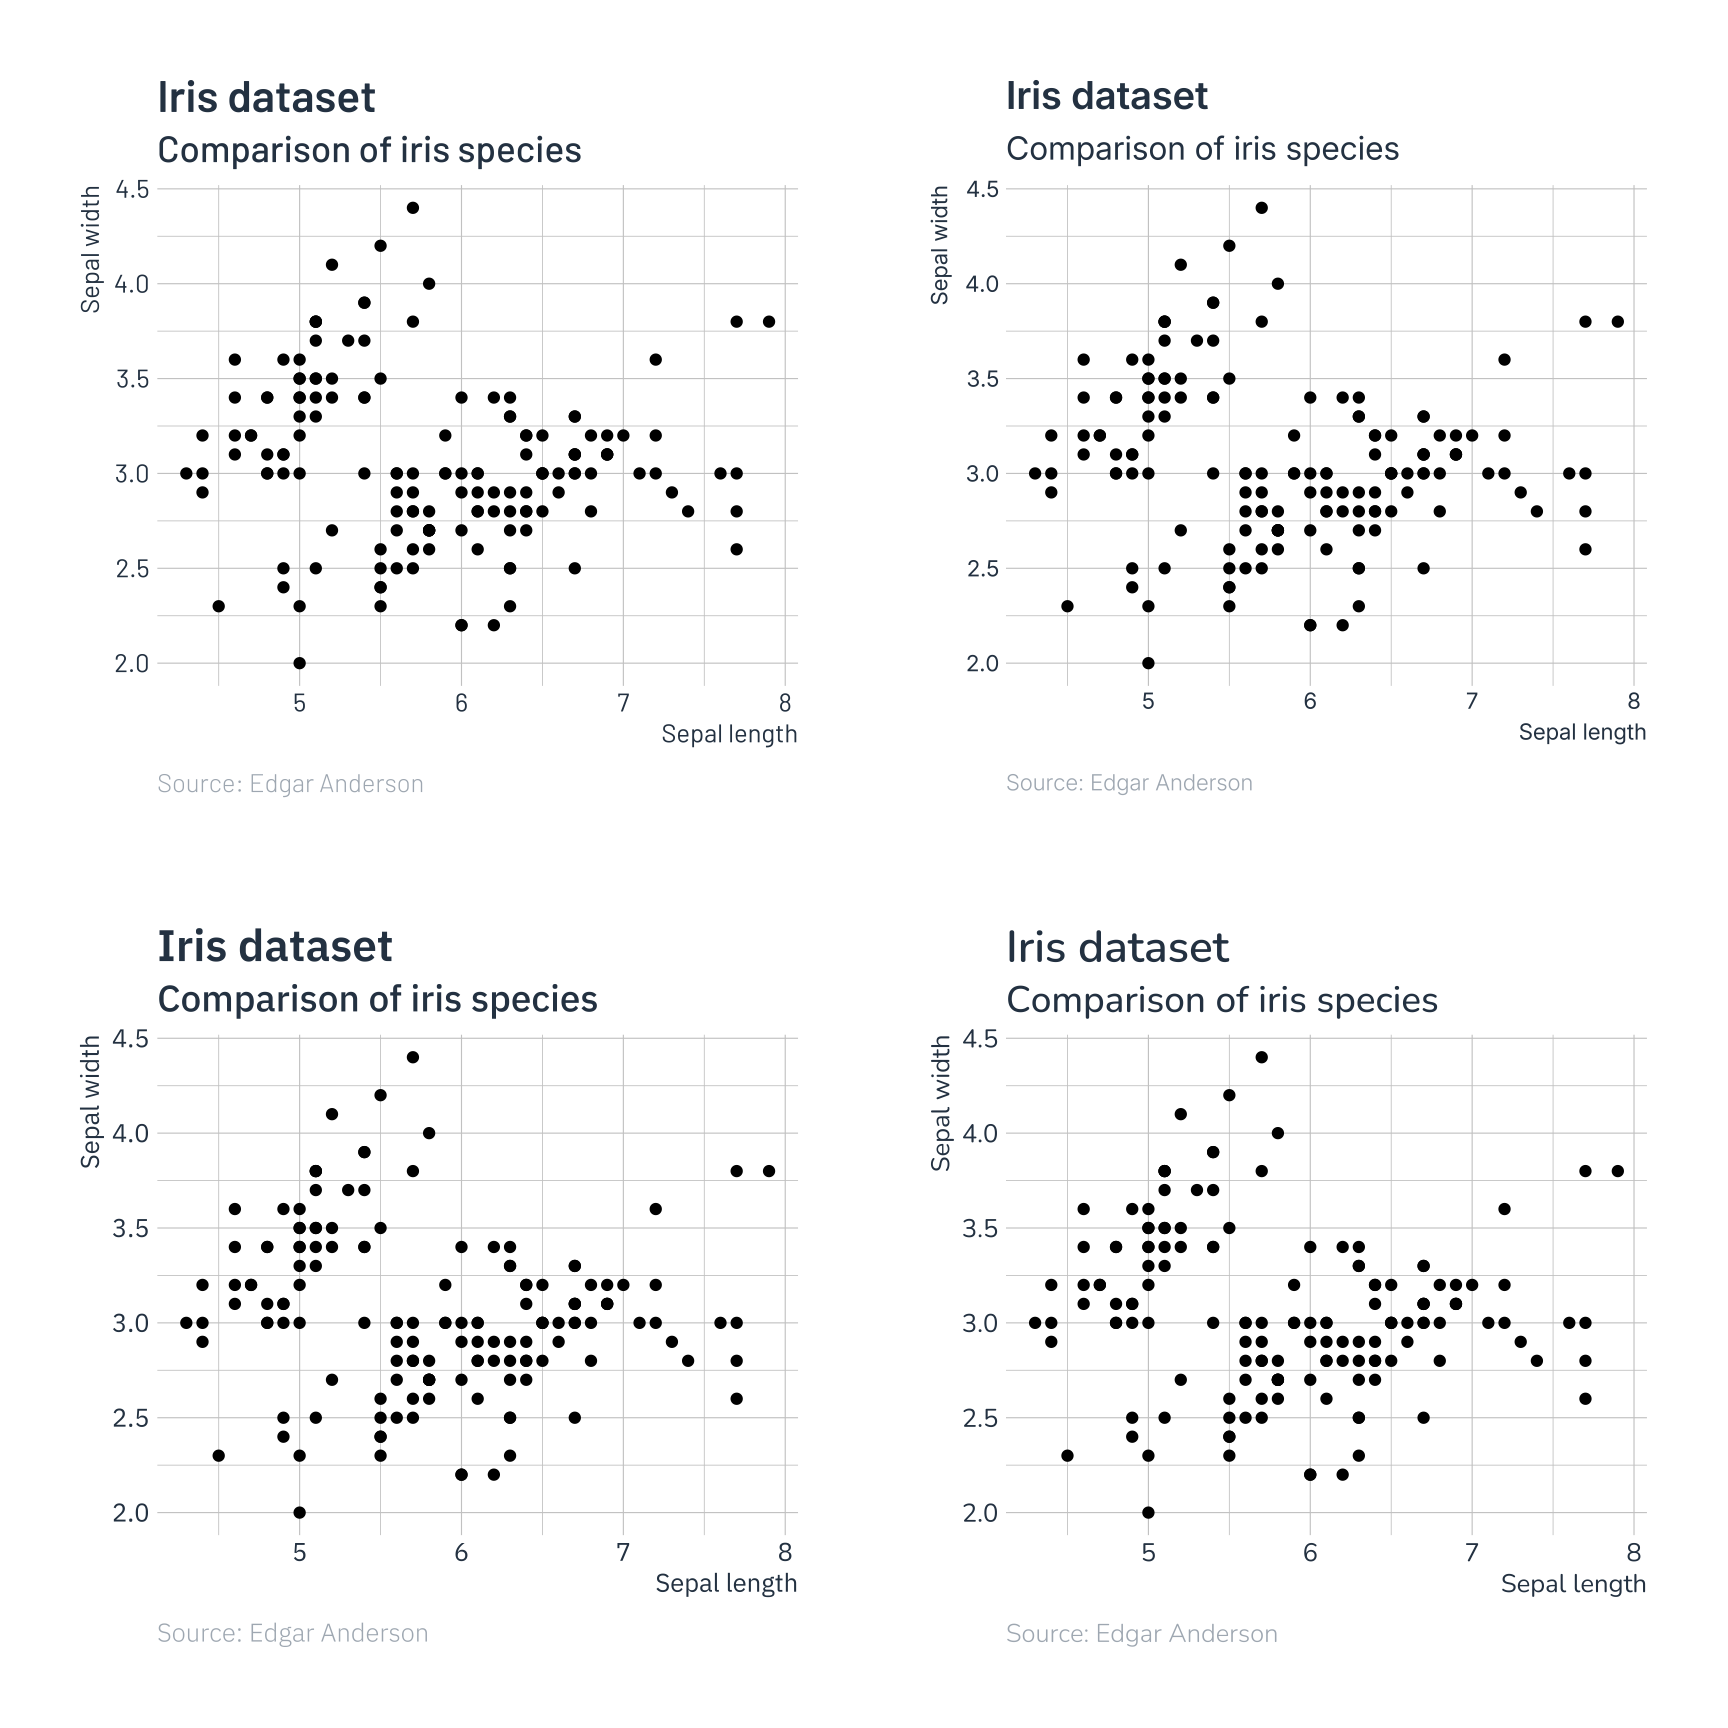
To set theme for all plots in a session, use
The package includes a few custom color palettes.

A preview of the color schemes.
p1 <- ggplot(iris, aes(Sepal.Length, Sepal.Width, color = Species)) +
  geom_point() +
  labs(
    title = "Iris dataset",
    subtitle = "Comparison of iris species",
    x = "Sepal length",
    y = "Sepal width",
    caption = "Source: Edgar Anderson"
  )

p2 <- p1 + scale_color_tableau() + plummy()
p3 <- p1 + scale_color_strong() + plummy()
p4 <- p1 + scale_color_morris() + plummy()
p5 <- p1 + scale_color_okabeito() + plummy()
wrap_plots(p2, p3, p4, p5, ncol = 2, nrow = 2)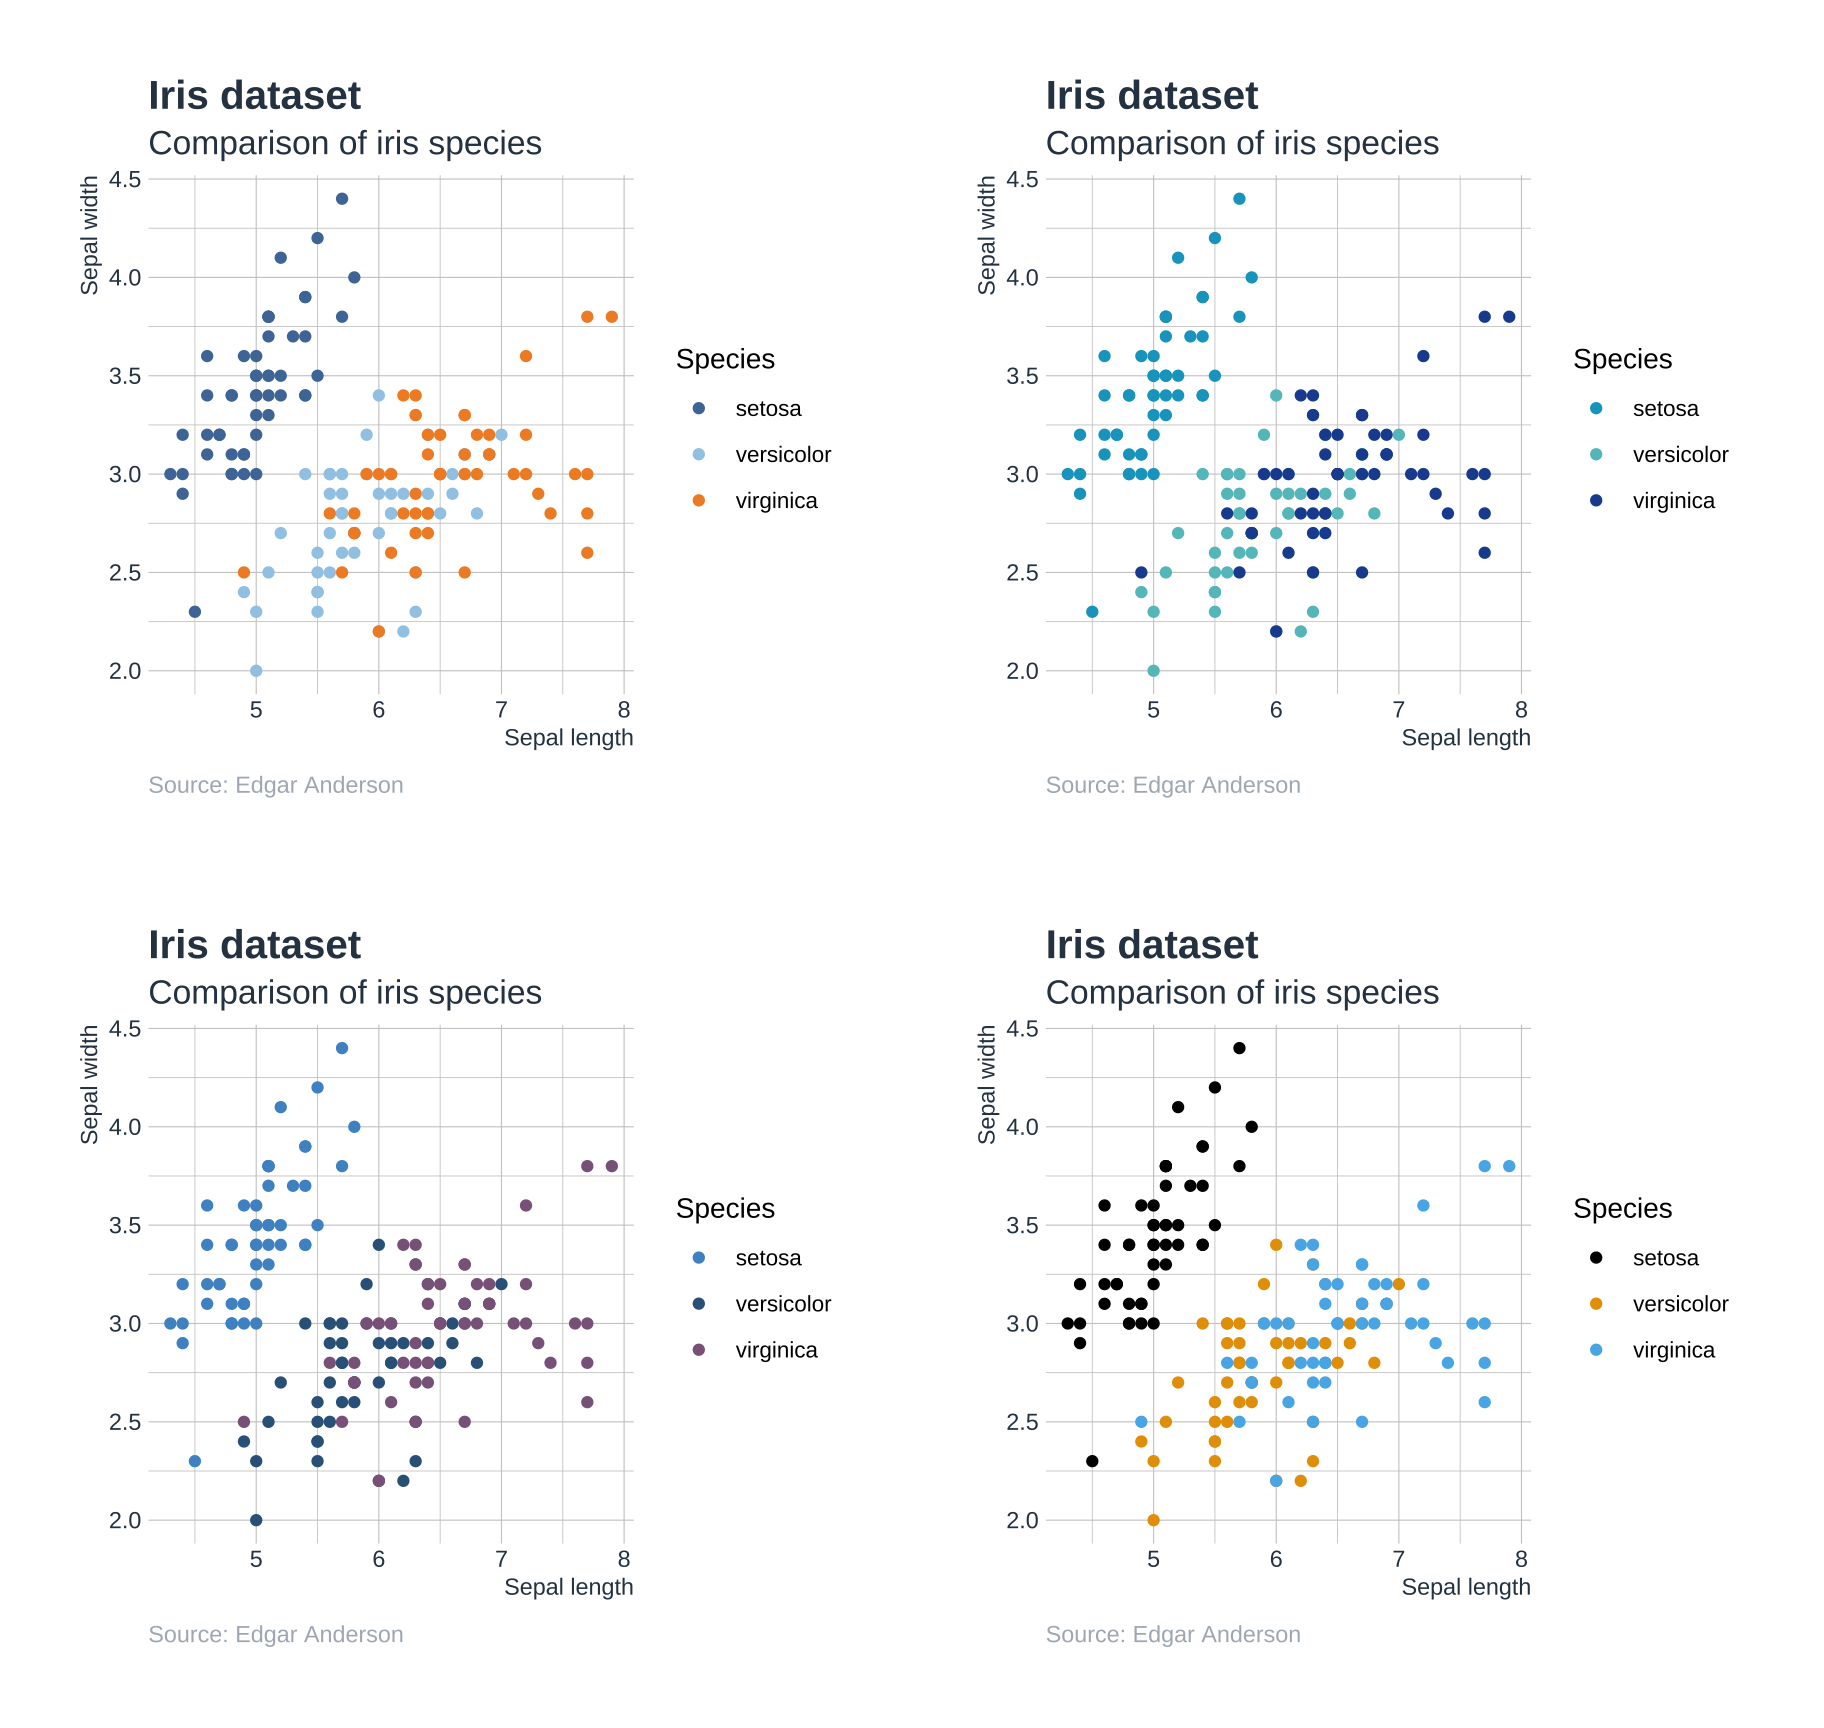
Below are examples of some of the customizations available in the plummy theme.
p2 <- p1 + scale_color_tableau() + plummy(family = "barlow", grid = "Y", leg = "h")
p3 <- p1 + scale_color_tableau() + plummy(family = "inter", grid = "y", leg = "h")
p4 <- p1 + scale_color_tableau() + plummy(family = "plex", grid = "X", leg = "h")
p5 <- p1 + scale_color_tableau() + plummy(family = "nunito", grid = FALSE, leg = "h")

wrap_plots(p2, p3, p4, p5, nrow = 2, ncol = 2)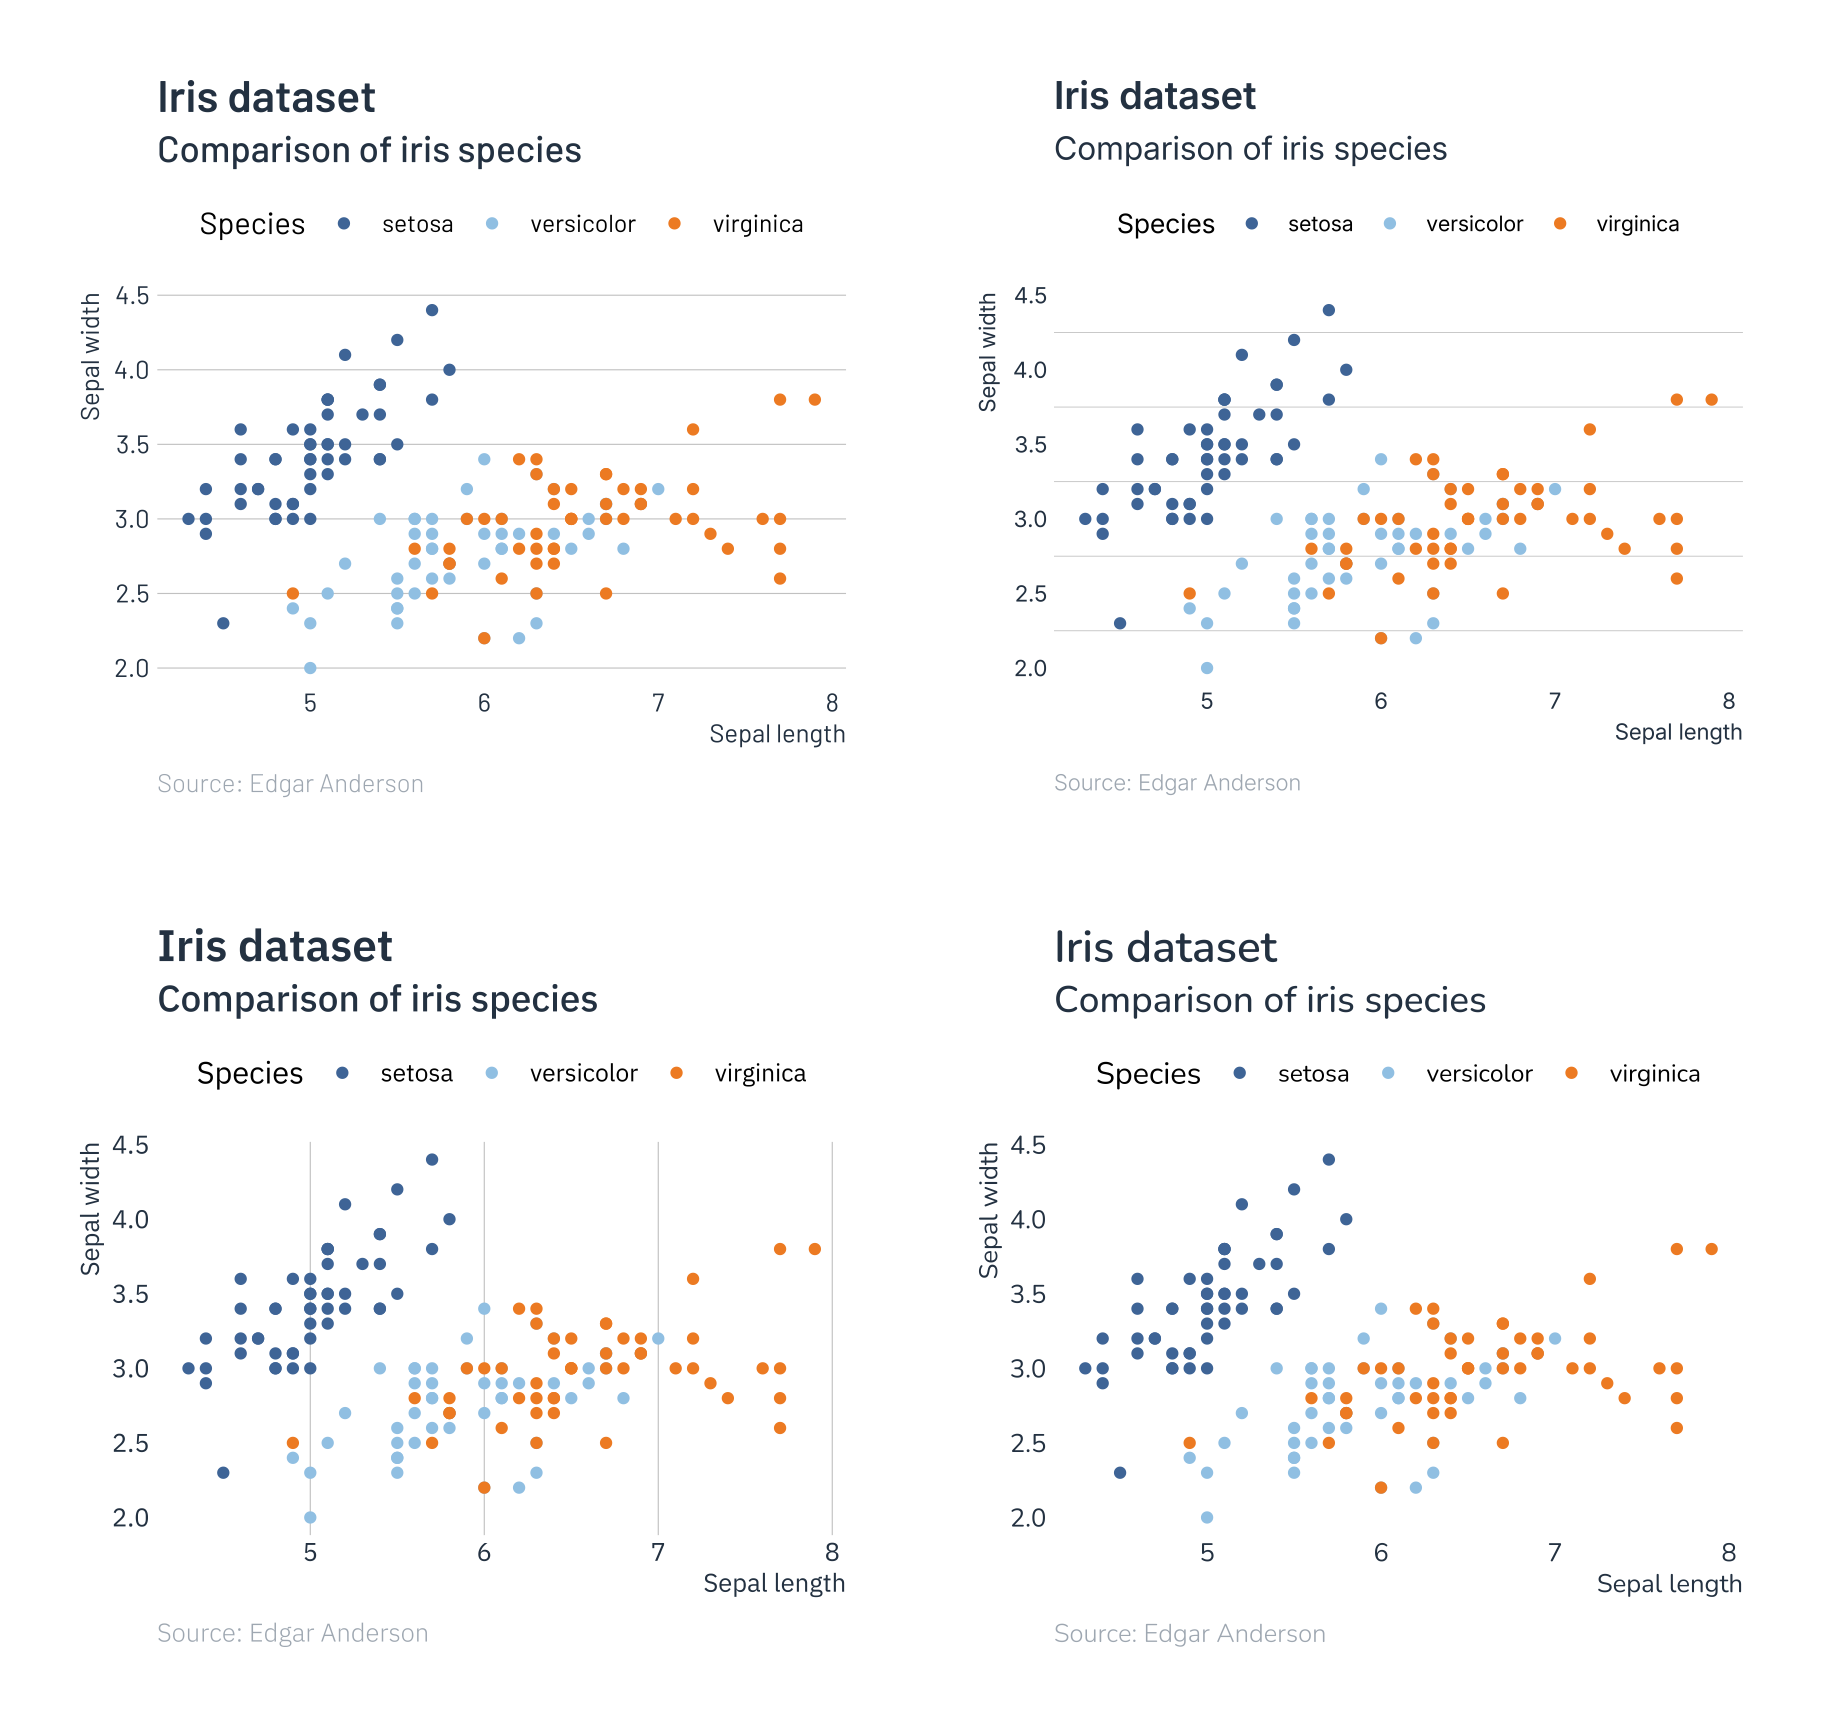
Next we take a look at examples with facetting.
p1 <- ggplot(iris, aes(Sepal.Length, Sepal.Width, color = Species)) +
  geom_point() +
  facet_grid(~Species) +
  labs(
    title = "Iris dataset",
    subtitle = "Comparison of iris species",
    x = "Sepal length",
    y = "Sepal width",
    caption = "Source: Edgar Anderson"
  ) +
  theme(legend.position = "top")
p2 <- p1 + scale_color_tableau() + plummy(title_margin = margin(b = 2), family = "inter", leg = "h")
p3 <- p1 + scale_color_strong() + plummy(title_margin = margin(b = 2), family = "plex", leg = "h")
p4 <- p1 + scale_color_morris() + plummy(title_margin = margin(b = 2), family = "nunito", leg = "h")

wrap_plots(p1, p2, p3, p4, nrow = 2, ncol = 2)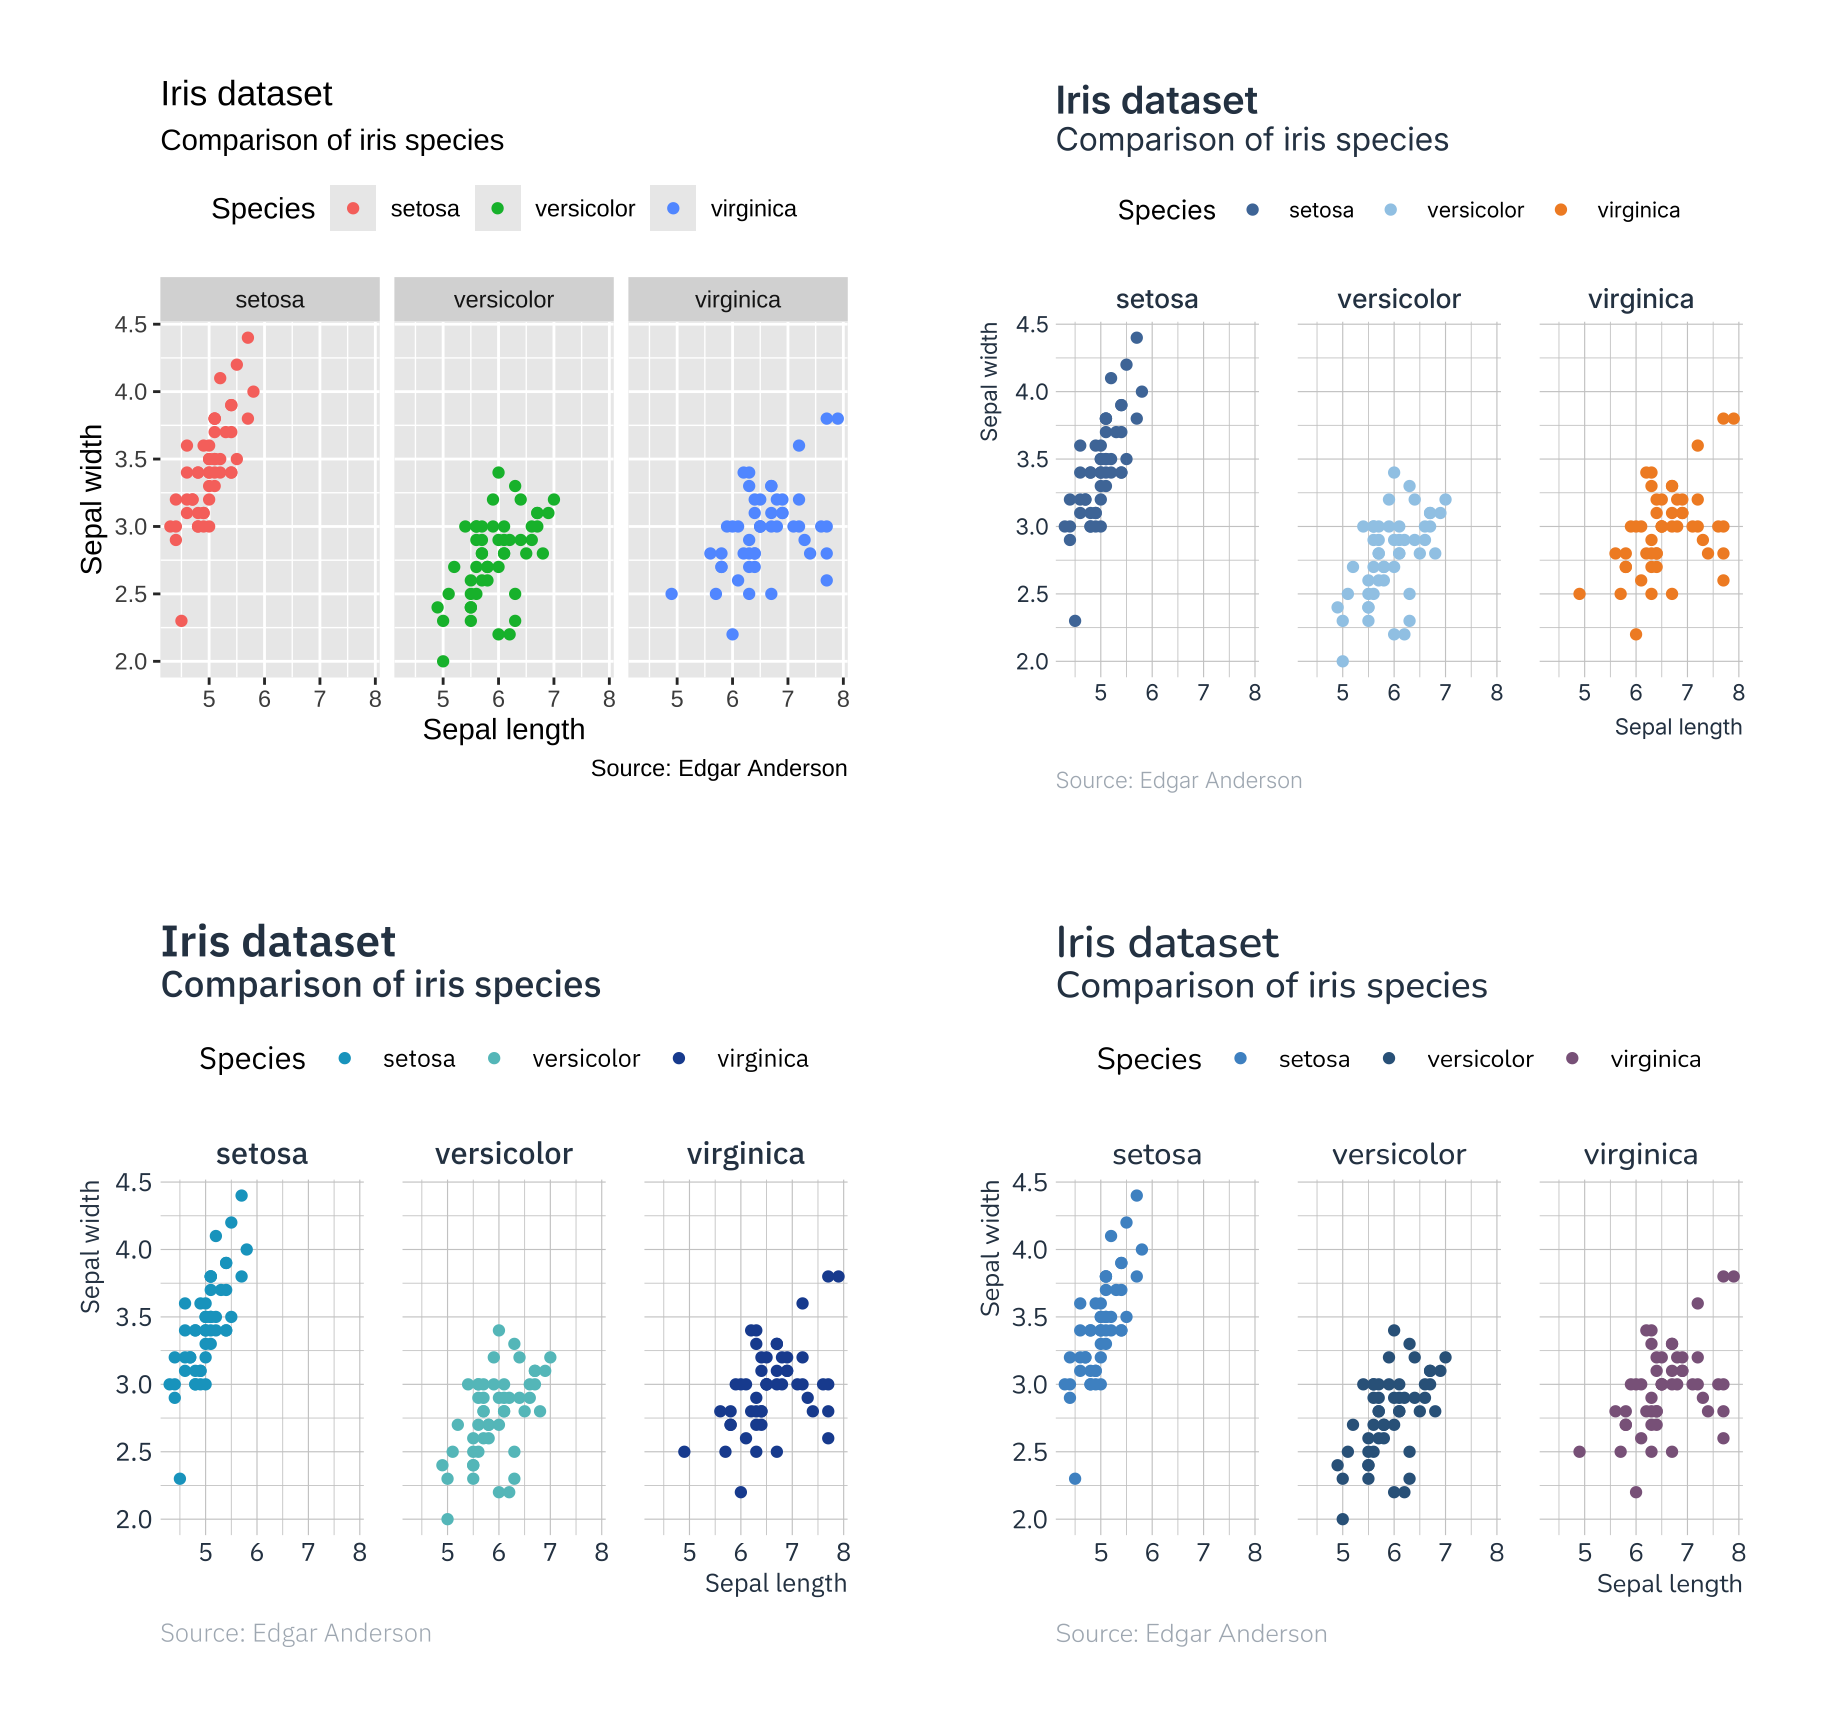
To set palette for all plots in a session, use
options(ggplot2.discrete.colour = palette_tableau()(20))
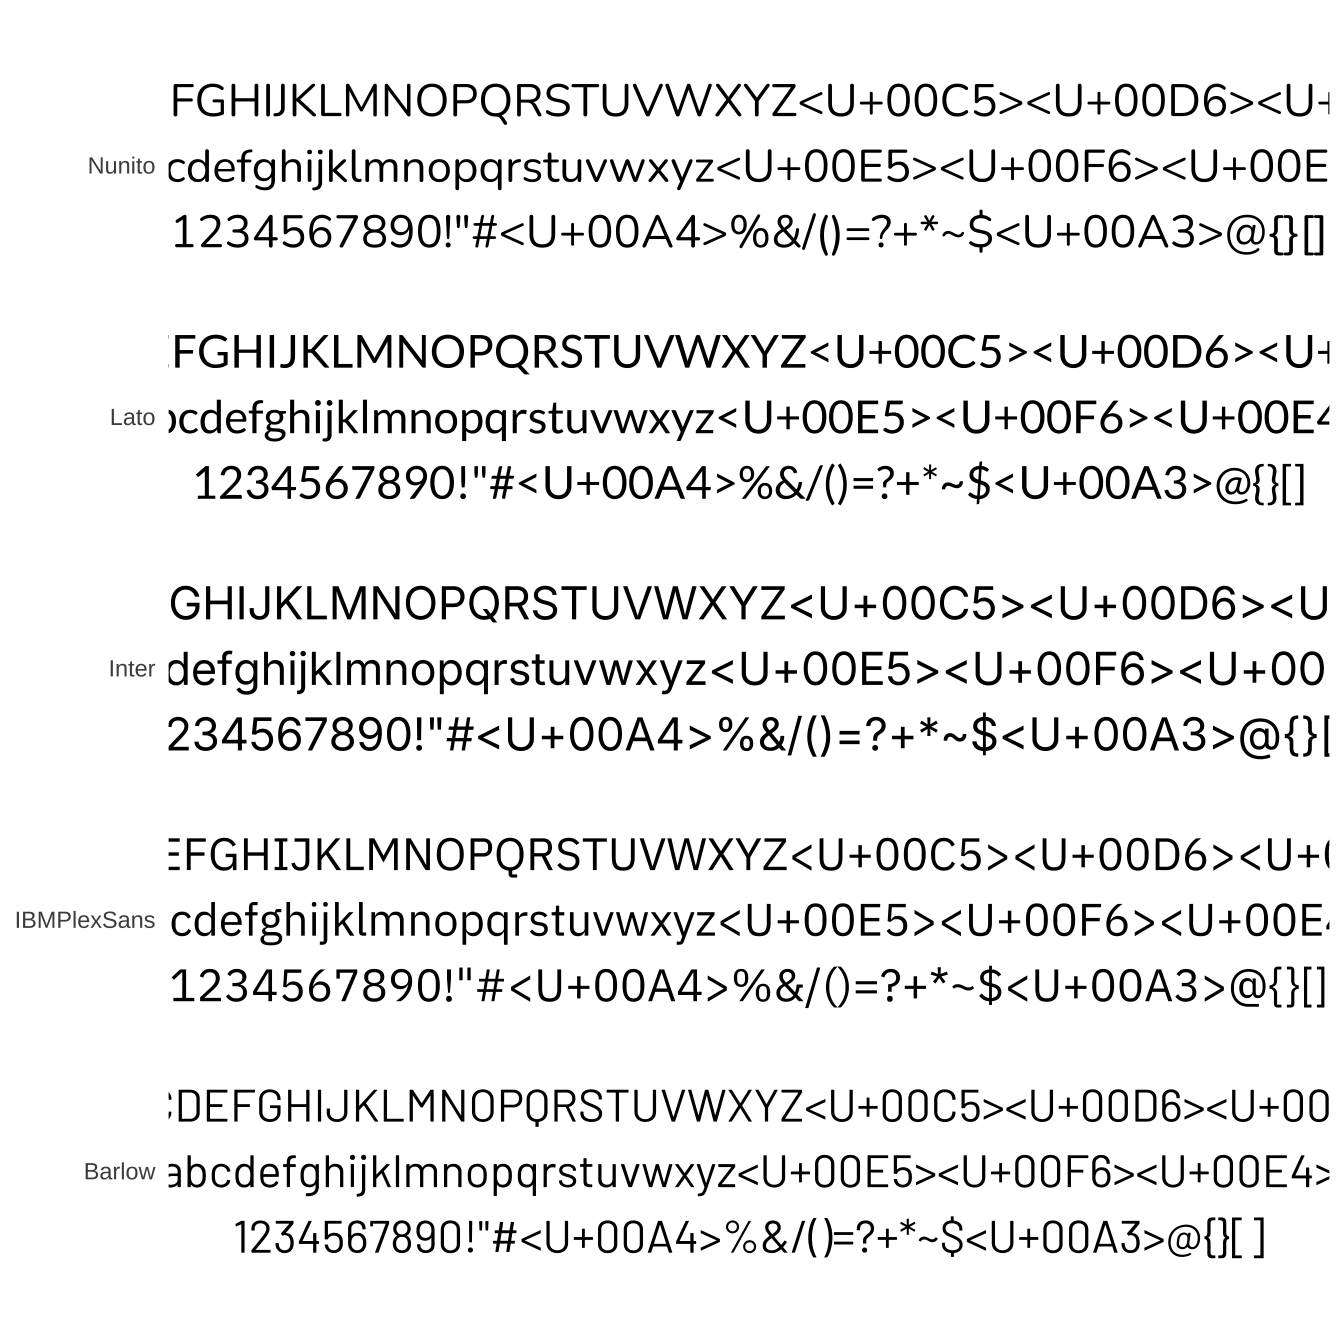
options(ggplot2.discrete.fill = palette_tableau()(20))Available fonts in the package can be listed using list_fonts(). Below is a preview of fonts.

Text in geoms are not controlled by theme. As an example, the plot below uses the plummy theme, but the geom_text() labels do not change to the theme font.
p2 <- ggplot(iris, aes(Sepal.Length, Sepal.Width)) +
  geom_point() +
  geom_text(data = iris[1:5, ], aes(label = Species)) +
  labs(
    title = "Iris dataset",
    subtitle = "Comparison of iris species",
    x = "Sepal length",
    y = "Sepal width",
    caption = "Source: Edgar Anderson"
  )

p2 + plummy(family = "nunito")
Geoms with text can be updated with custom font using update_geom_font().
update_geom_font(family = "nunito")
p2 + plummy(family = "nunito")
It is also possible to use any google font by providing font names to the family argument in plummy().
sysfonts::font_add_google(name = "Roboto Slab", family = "robotoslab")
update_geom_font(family = "robotoslab")

update_geom_font(family = "robotoslab")
p2 + plummy(family = "robotoslab")