
I had this idea of using some of my travel photos to create a photo calendar. I would normally go about it using Adobe Photoshop or Adobe Illustrator. But, that would involve a lot of manual work placing dates and days for each month. I would also like to mark some public holidays and friend’s birthdays. So, I wondered if it might be possible to do it with R. After fiddling about with it over the weekend, I managed to make it work. It went better than I expected. And here I am recreating the calendar using some stock photos. All stock photos are royalty-free from Pexels. For the impatient ones, the whole code and images are available at this Github repository. For detailed guide, keep reading.

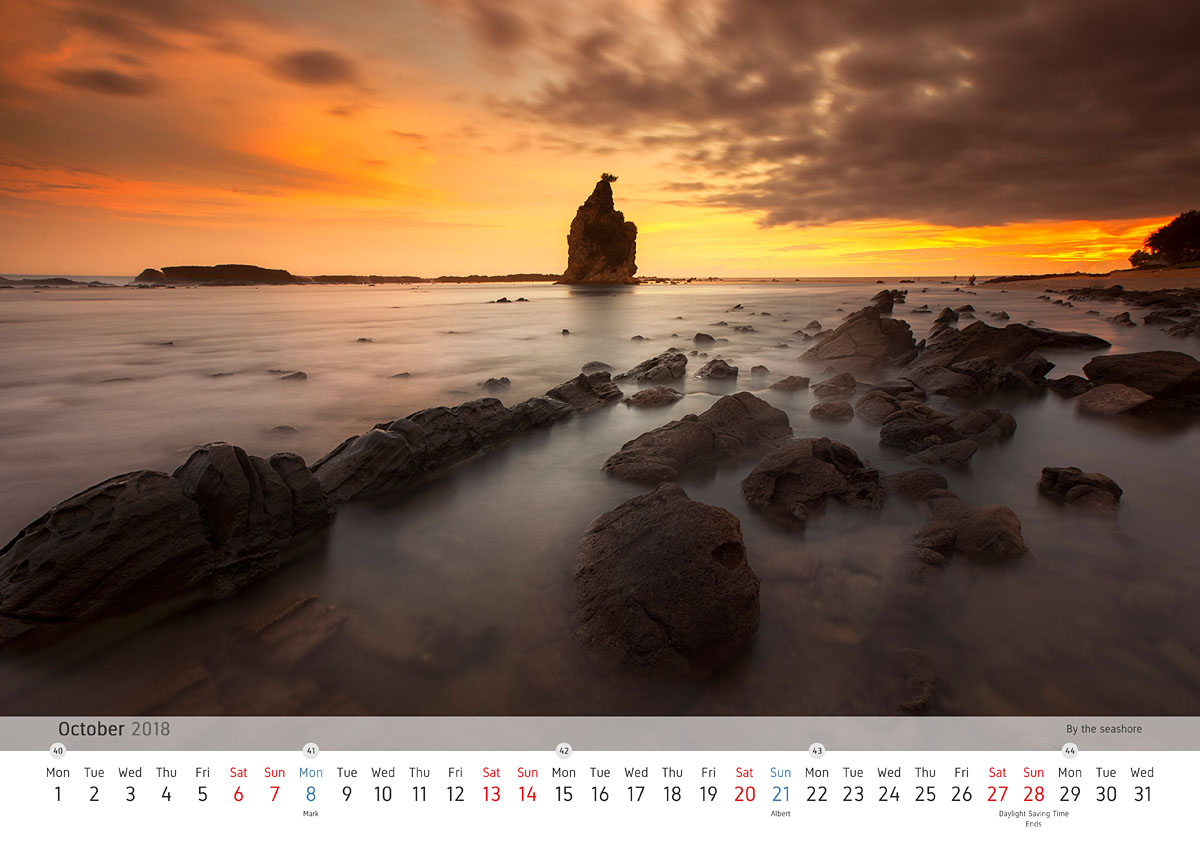
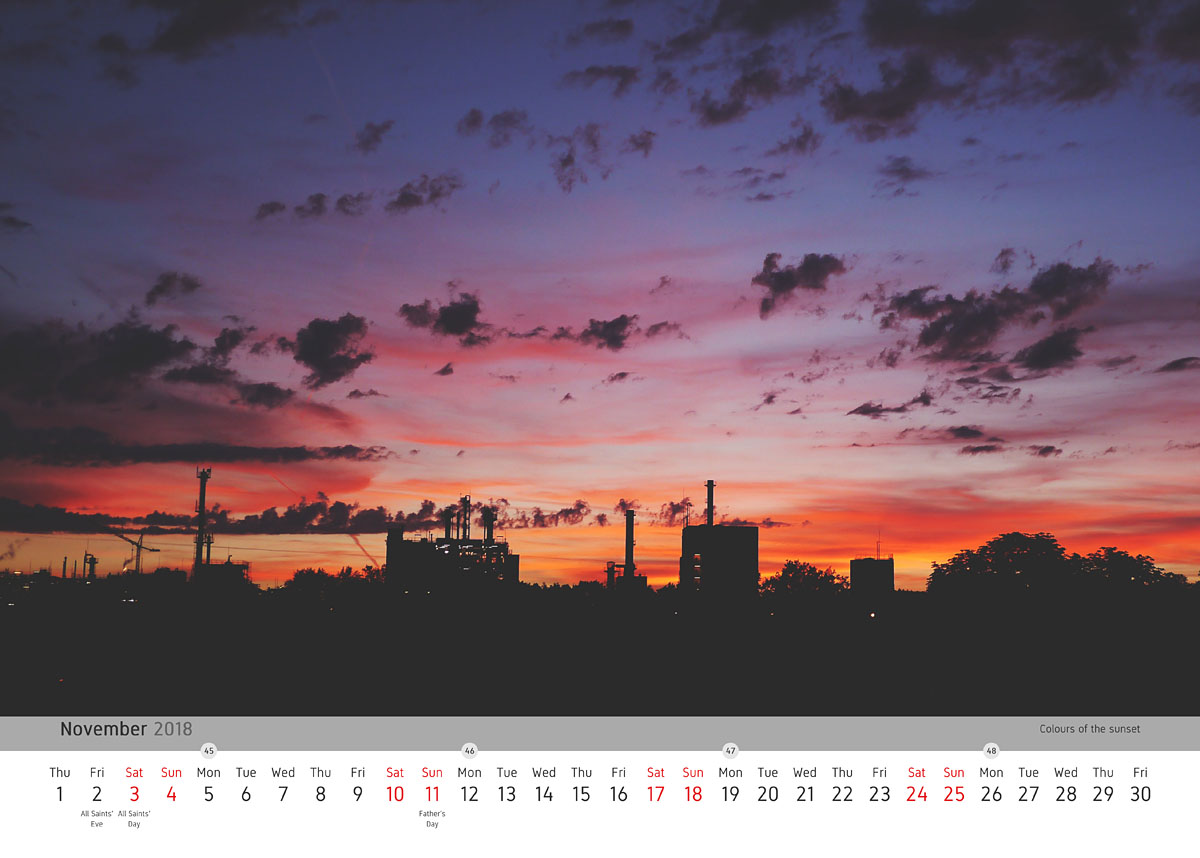
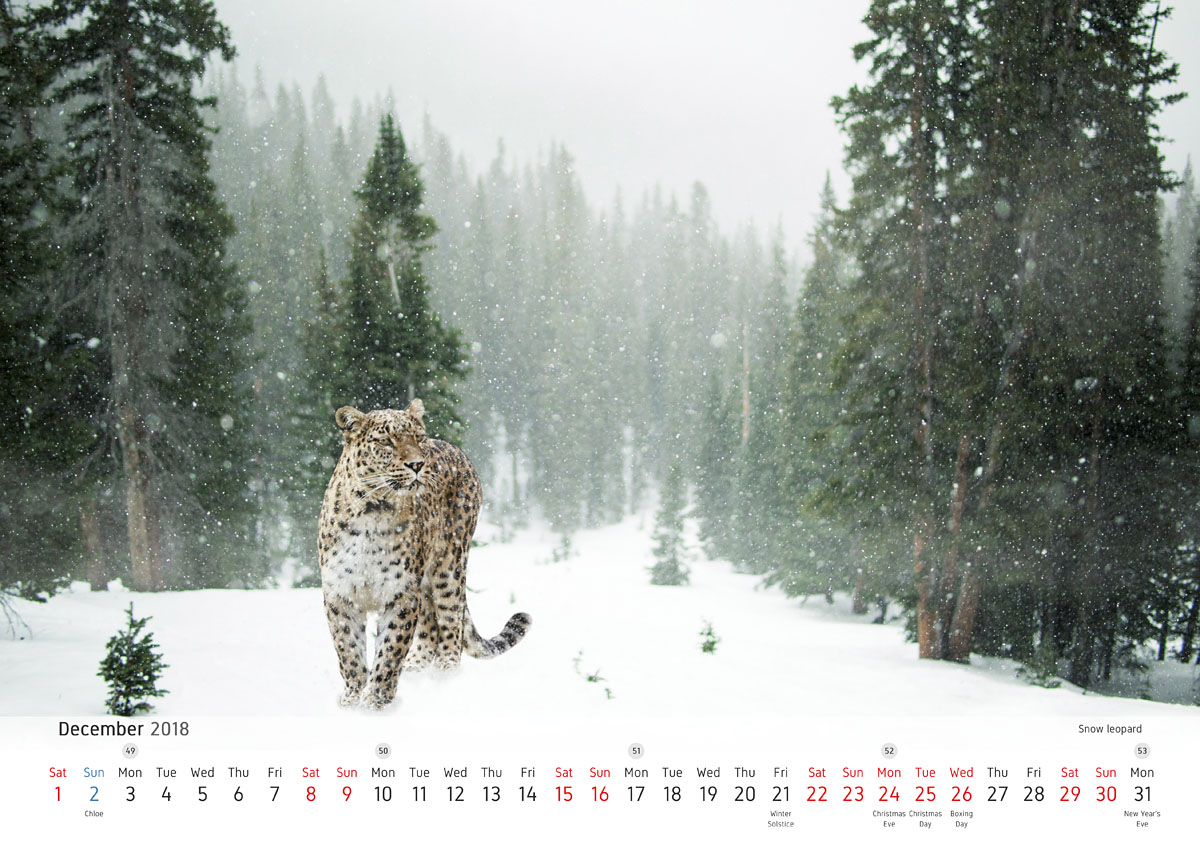
The calendar is designed in A3 size format. Twelve photos are selected, labelled 1.jpg to 12.jpg. The photos are first sized to exactly A3 size using an image editing software and placed in a directory labelled ‘images’. A text file is prepared with important dates and description such as holidays, birthdays etc. Another text file is prepared with month and photo caption.
The packages required are loaded.
# load libraries
library(ggplot2) # for plotting
library(stringr) # for text processing
library(Cairo) # for graphics
library(extrafont) # for custom fonts
library(png) # read png
library(jpeg) # read jpeg
I use the font Gidole for the calendar. This was installed on my system and imported using the package ‘extrafont’. I follow the workflow for Windows OS. Mac and linux users might need different commands for configuring font.
# prepare fonts
font_import(pattern="Gidole", prompt=FALSE)
loadfonts(device="win")
windowsFonts(sans="Gidole")
Export image size is set as A3. An extra 6 mm bleed edges is added to aid in trimming the print.
img_bleed <- 6
img_height <- 297+(img_bleed*2)
img_width <- 420+(img_bleed*2)
img_dpi <- 300
img_units <- "mm"
export <- "png"
The raw calendar dates are prepared.
# PREPARE CALENDAR DATA.FRAME
dates <- seq(as.Date("2018-01-01"), as.Date("2018-12-31"), "days")
df_raw <- data.frame(fulldate=as.character(dates),
                  date=as.numeric(strftime(dates, format="%d")),
                  month=as.numeric(strftime(dates, format="%m")),
                  year=strftime(dates, format="%Y"),
                  day=strftime(dates, format="%a"),
                  week=strftime(dates, format="%W"),
                  stringsAsFactors=F)
Marked dates with description are read in.
# read marked dates and description
marked <- read.delim("marked.txt", sep="\t", header=T, stringsAsFactors=F)<br>


> head(marked)
    date                 description           type
1 Jan 01              New Year's Day public holiday
2 Mar 20              Spring Equinox           none
3 Mar 25 Daylight Saving Time Starts           none
4 Mar 30                 Good Friday public holiday
5 Mar 31               Holy Saturday   half holiday
6 Apr 01                  Easter Day public holiday
Multi word descriptions are split to two lines. New line character ‘\n’ is added to the last space in the description. Character dates is converted to actual R dates.
# add newline to last space in the description
marked$description <- str_replace(marked$description, " [:alnum:]+$", str_replace(str_extract(marked$description, " [:alnum:]+$"), " ", "\n"))
# create R dates
marked$fulldate <- as.character(strftime(as.Date(str_replace_all(paste0(marked$date, " 2018"), " ", "-"), format="%b-%d-%Y"), format="%Y-%m-%d"))
# identify duplicate dates if any
marked[which(duplicated(marked$fulldate)), ]
# remove character date
marked$date <- NULL

> head(marked)
                    description           type   fulldate
1              New Year's\nDay public holiday 2018-01-01
2              Spring\nEquinox           none 2018-03-20
3 Daylight Saving Time\nStarts           none 2018-03-25
4                 Good\nFriday public holiday 2018-03-30
5               Holy\nSaturday   half holiday 2018-03-31
6                  Easter\nDay public holiday 2018-04-01
Marked dates are merged with the calendar. Empty descriptions ‘NA’ are marked as ‘not important’. Weekends and public holidays are assigned the font colour red and birthdays are assigned the font colour blue. Start of week is marked. Based on the newline character added previously, descriptions are split into two for plotting on two lines.
# merge calendar and marked dates
df_cal <- merge(df_raw, marked, by="fulldate", all.x=T)
# mark NA descriptions as not important
df_cal$type[is.na(df_cal$type)] <- "not important"
# assign red colour to public holidays and weekends
df_cal$holiday <- ifelse(df_cal$day=="Sat"|df_cal$day=="Sun"|df_cal$type=="public holiday", "#e41a1c", "grey20")
# assign blue colour to birthdays
df_cal$holiday[df_cal$type=="birthday"] <- "steelblue"
# mark start of week
df_cal$week <- ifelse(df_cal$day=="Mon", df_cal$week, NA)
# alpha of background shape for week
df_cal$weekbgalpha <- ifelse(is.na(df_cal$week), 0, 1)
# split description into two lines
df_cal$description <- paste0(df_cal$description, "\nx")
df_cal$description1 <- sapply(strsplit(df_cal$description, "\n"), "[[", 1)
df_cal$description2 <- sapply(strsplit(df_cal$description, "\n"), "[[", 2)
df_cal$description1[df_cal$description1=="NA"] <- NA
df_cal$description2[df_cal$description2=="x"] <- NA

> head(df_cal)
    fulldate date month year day week        description           type
1 2018-01-01    1     1 2018 Mon   01 New Year's\nDay\nx public holiday
2 2018-01-02    2     1 2018 Tue <NA>              NA\nx  not important
3 2018-01-03    3     1 2018 Wed <NA>              NA\nx  not important
4 2018-01-04    4     1 2018 Thu <NA>              NA\nx  not important
5 2018-01-05    5     1 2018 Fri <NA>              NA\nx  not important
6 2018-01-06    6     1 2018 Sat <NA>              NA\nx  not important
  holiday weekbgalpha description1 description2
1 #e41a1c           1   New Year's          Day
2  grey20           0         <NA>         <NA>
3  grey20           0         <NA>         <NA>
4  grey20           0         <NA>         <NA>
5  grey20           0         <NA>         <NA>
6 #e41a1c           0         <NA>         <NA>
Image captions and caption colour file is read in.
# prepare image captions
cap <- read.delim("captions.txt", header=T, stringsAsFactors=F)
> head(cap)
month description textcol
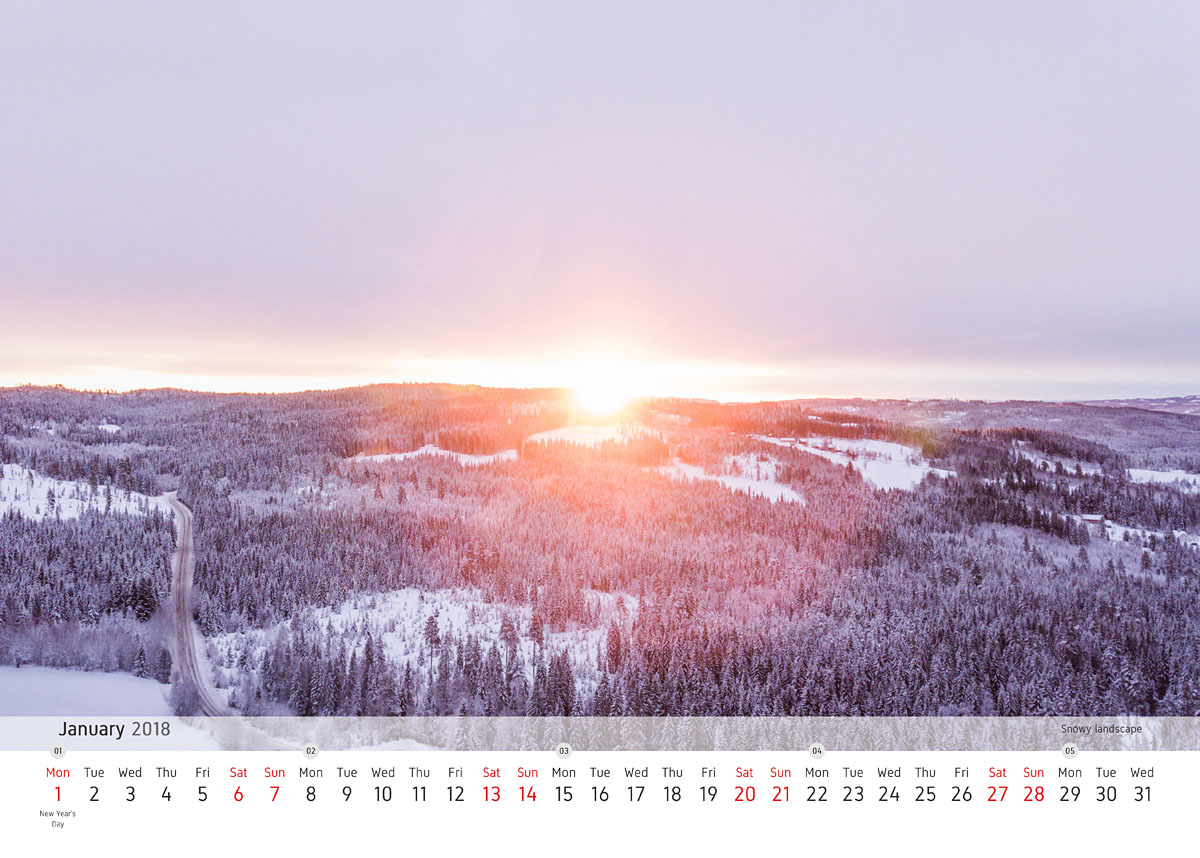
1 1 Snowy landscape grey20
2 2 Snowfall on the leaves grey20
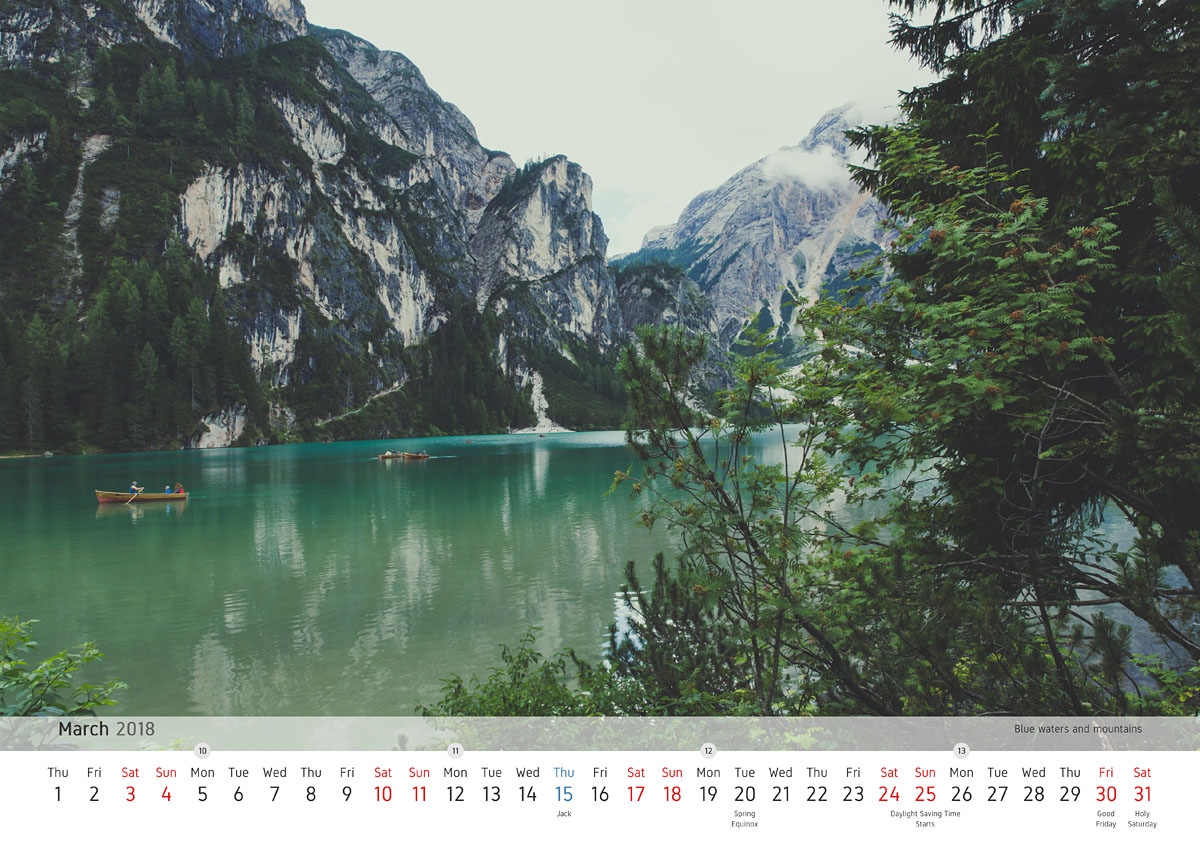
3 3 Blue waters and mountains grey20
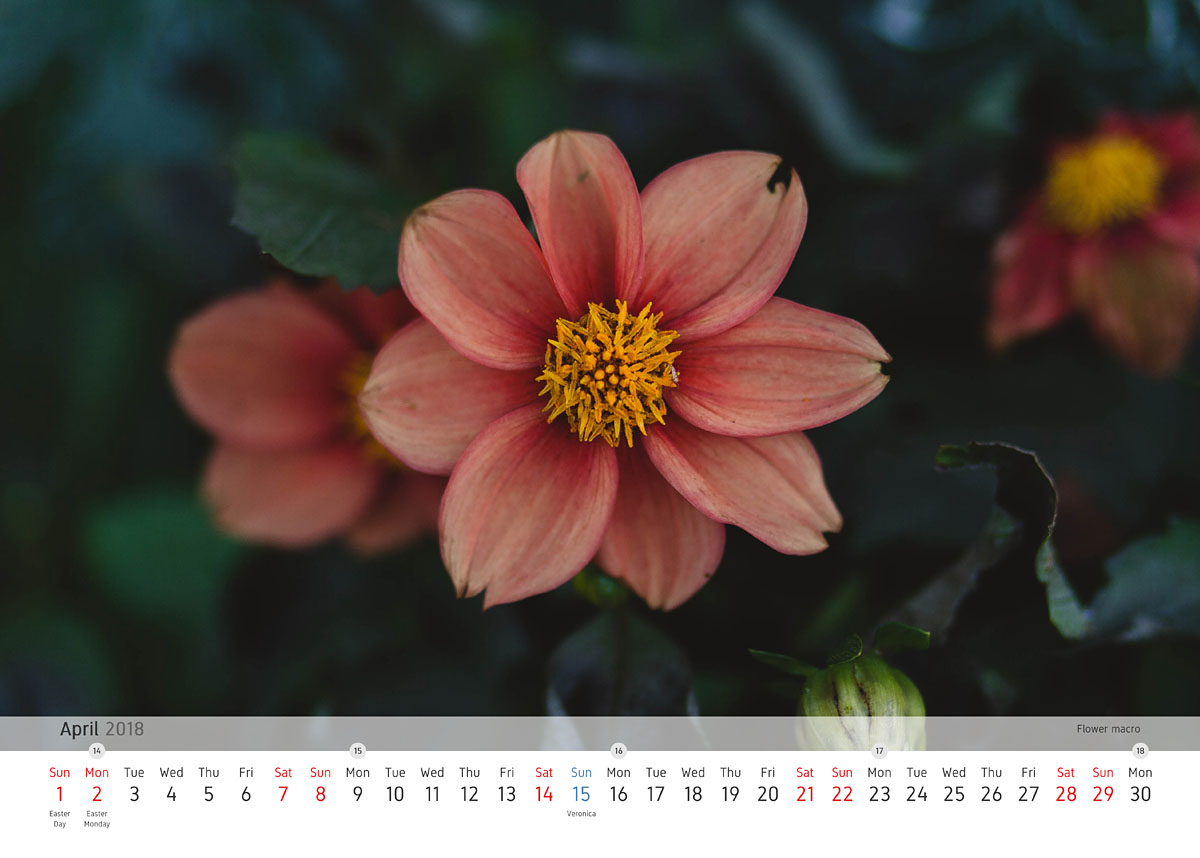
4 4 Flower macro grey20
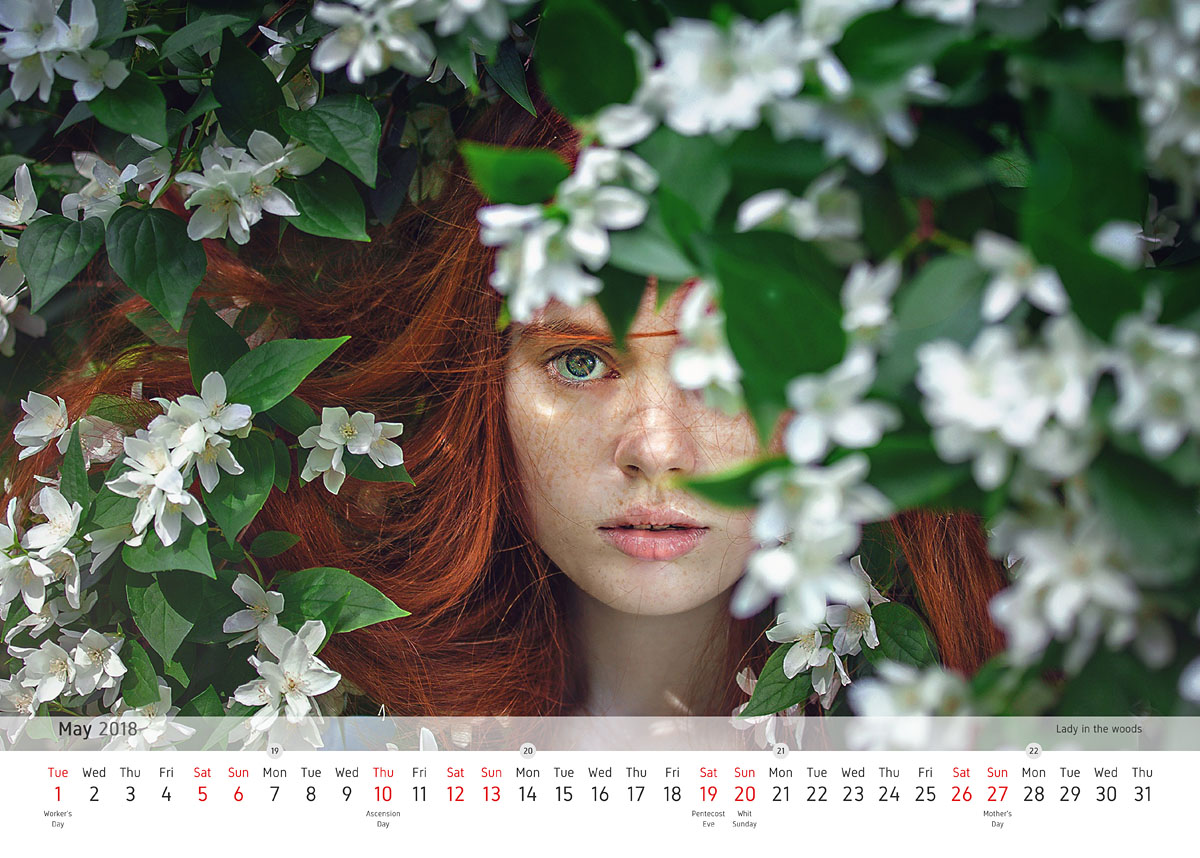
5 5 Lady in the woods grey20
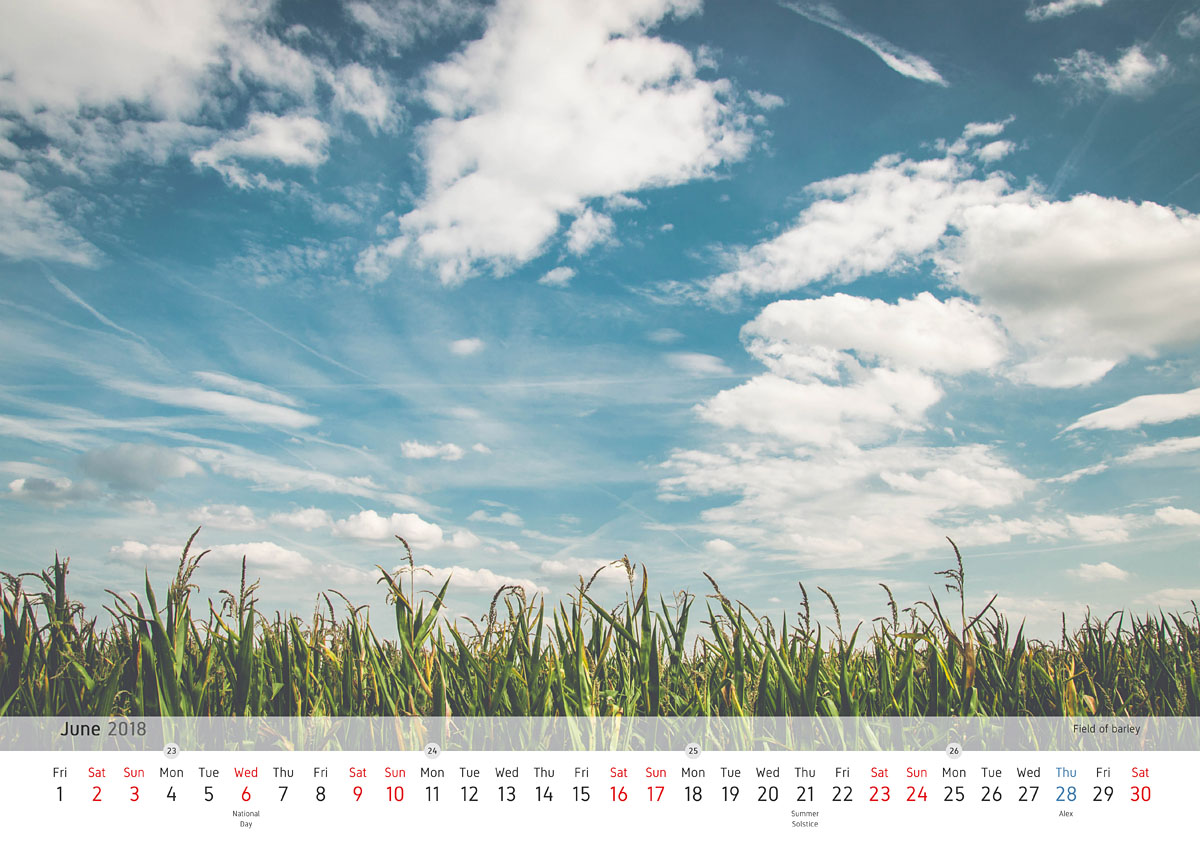
6 6 Field of barley grey20
Positions of the various text elements are defined bottom-up. ‘basepos’ is an arbitrary base line position which helps to move all text up or down. ‘markpos1’ defines second line of marked date description, ‘markpos2’ defines first line of marked date description. ‘datepos’ defines the row of date numbers. ‘daypos’ defines the row of day text. ‘weekpos’ defines the row of week numbers. ‘monthpos’ defines the position of the month.
# set text position variables
basepos <- 0.35
df_cal$markpos1 <- basepos+0.08
df_cal$markpos2 <- df_cal$markpos1[1]+0.12
df_cal$datepos <- df_cal$markpos2[1]+0.20
df_cal$daypos <- df_cal$datepos[1]+0.25
df_cal$weekpos <- df_cal$daypos[1]+0.25
df_cal$monthpos <- df_cal$weekpos[1]+0.26

> head(df_cal)
fulldate date month year day week        description           type
1 2018-01-01    1     1 2018 Mon   01 New Year's\nDay\nx public holiday
2 2018-01-02    2     1 2018 Tue <NA>              NA\nx  not important
3 2018-01-03    3     1 2018 Wed <NA>              NA\nx  not important
4 2018-01-04    4     1 2018 Thu <NA>              NA\nx  not important
5 2018-01-05    5     1 2018 Fri <NA>              NA\nx  not important
6 2018-01-06    6     1 2018 Sat <NA>              NA\nx  not important
  holiday weekbgalpha description1 description2 markpos1 markpos2
1 #e41a1c           1   New Year's          Day     0.43     0.55
2  grey20           0         <NA>         <NA>     0.43     0.55
3  grey20           0         <NA>         <NA>     0.43     0.55
4  grey20           0         <NA>         <NA>     0.43     0.55
5  grey20           0         <NA>         <NA>     0.43     0.55
6 #e41a1c           0         <NA>         <NA>     0.43     0.55
  datepos daypos weekpos monthpos
1    0.75      1    1.25     1.51
2    0.75      1    1.25     1.51
3    0.75      1    1.25     1.51
4    0.75      1    1.25     1.51
5    0.75      1    1.25     1.51
6    0.75      1    1.25     1.51
The loop reads the image for each month and converts to a grob. A ggplot object is created and the calendar along with the markings are printed. The ggplot object and the image grob are combined and exported.
# EXPORT LOOP
# loop to create and export monthwise
levs <- levels(factor(df_cal$month))
for(i in 1:length(levs))
{
  fullmonth <- month.name[i]
  message(paste0("Running ", fullmonth, " ..."))

  # subset one month
  single <- subset(df_cal, df_cal$month==i)

  # read background image
  #pic <- readPNG(paste0("./images/", i, ".png"))
  pic <- readJPEG(paste0("./images/", i, ".jpg"))
  pic1 <- grid::rasterGrob(pic)
  pic1$width <- unit(1, "npc")
  pic1$height <- unit(1, "npc")

  # create final image
  p <- ggplot(single)+
    # background image
    annotation_custom(pic1)+
    # background rectangle 1
    annotate("rect", xmin=-Inf, xmax=Inf, ymin=0, ymax=single$weekpos[1], alpha=1, fill="white")+
    # background rectangle 2
    annotate("rect", xmin=-Inf, xmax=Inf, ymin=single$weekpos[1], ymax=single$weekpos[1]+0.4, alpha=0.6, fill="white")+
    # month title text faded with year
    annotate("text", x=1, y=single$monthpos[1], label=paste0(fullmonth, " 2018"), size=7, hjust=0, col="grey40", fontface="bold")+
    # month title text
    annotate("text", x=1, y=single$monthpos[1], label=fullmonth, size=7, hjust=0, col="grey20", fontface="bold")+
    # image description text
    annotate("text", x=single$date[nrow(single)], y=single$monthpos[1], label=cap$description[i], size=4, hjust=1, col=cap$textcol[i])+
    # week background circle
    geom_point(aes(x=date, y=weekpos), size=11, colour="grey90", alpha=single$weekbgalpha, shape=20)+
    # week text
    geom_text(aes(x=date, y=weekpos), label=single$week, size=3, col="grey20", fontface="bold")+
    # day text
    geom_text(aes(x=date, y=daypos), label=single$day, size=4.8, col=single$holiday)+
    # date text
    geom_text(aes(x=date, y=datepos), label=single$date, size=7.5, col=single$holiday)+
    # important information text line 1
    geom_text(aes(x=date, y=markpos1), label=single$description2, size=2.8, col="grey20", vjust=1)+
    # important information text line 2
    geom_text(aes(x=date, y=markpos2), label=single$description1, size=2.8, col="grey20", vjust=1)+
    # limit scales
    scale_x_continuous(limits=c(0, max(single$date)+1), expand=c(0, 0.6))+
    scale_y_continuous(limits=c(0, 10), expand=c(0, 0))+
    labs(x=NULL, y=NULL)+
    theme_bw(base_family="Gidole")+
    # remove graph elements
    theme(plot.background=element_rect(fill="transparent", colour=NA),
          plot.margin = margin(c(0, 0, 0, 0)),
          axis.title = element_blank(),
          axis.text = element_blank(),
          axis.ticks = element_blank(),
          axis.ticks.length = unit(0, "pt"),
          axis.line = element_blank(),
          panel.grid = element_blank(),
          panel.border = element_blank(),
          panel.background=element_rect(fill="transparent", colour=NA),
          panel.ontop=TRUE)

  # export image
  if(export=="png")
  {
    png(filename=paste0(single$month[1], ".png"), height=img_height,
          width=img_width, res=img_dpi, units=img_units, family="Gidole",
          bg="transparent", type="cairo")
    print(p)
    dev.off()
    message(paste0("Exported ", single$month[1], ".png"))
  }

  if(export=="tiff")
  {
    tiff(filename=paste0(single$month[1], ".tiff"), height=img_height,
              width=img_width, res=img_dpi, units=img_units, family="Gidole",
              compression="lzw", type="cairo", bg="transparent")
    print(p)
    dev.off()
    message(paste0("Exported ", single$month[1], ".tiff"))
  }

  if(export=="pdf")
  {
    pdf(file=paste0(single$month[1], ".pdf"), height=round(img_height*0.039, 0),
        width=round(img_width*0.039, 0), family="Gidole")
    print(p)
    dev.off()
    message(paste0("Exported ", single$month[1], ".pdf"))
  }
}
I created a cover page as well. If you are interested in the font, the script font is Bira and the slim sans-serif font is Gidole.

The images are exported in png format here. But for print, PNG is not an ideal format. Instead, JPEG or pdf might be better. I imported all the PNGs into Adobe Indesign and created a single print quality PDF. You can also set 6 mm of bleed edges in Indesign. I sent the PDF off to print and the results were glorious. Go forth and let your creativity flow. Make yourself a calendar for next year.
The full code along with images are available at this Github repository.
Comments