In my previous post, I created a calendar planner plot using ggplot2. I wanted to take it further and create a shiny app for it. This was more of a shiny learning exercise rather than a purpose-driven app. Specifically, creating dynamic user inputs and retrieving data from these inputs.
The app looks like this:
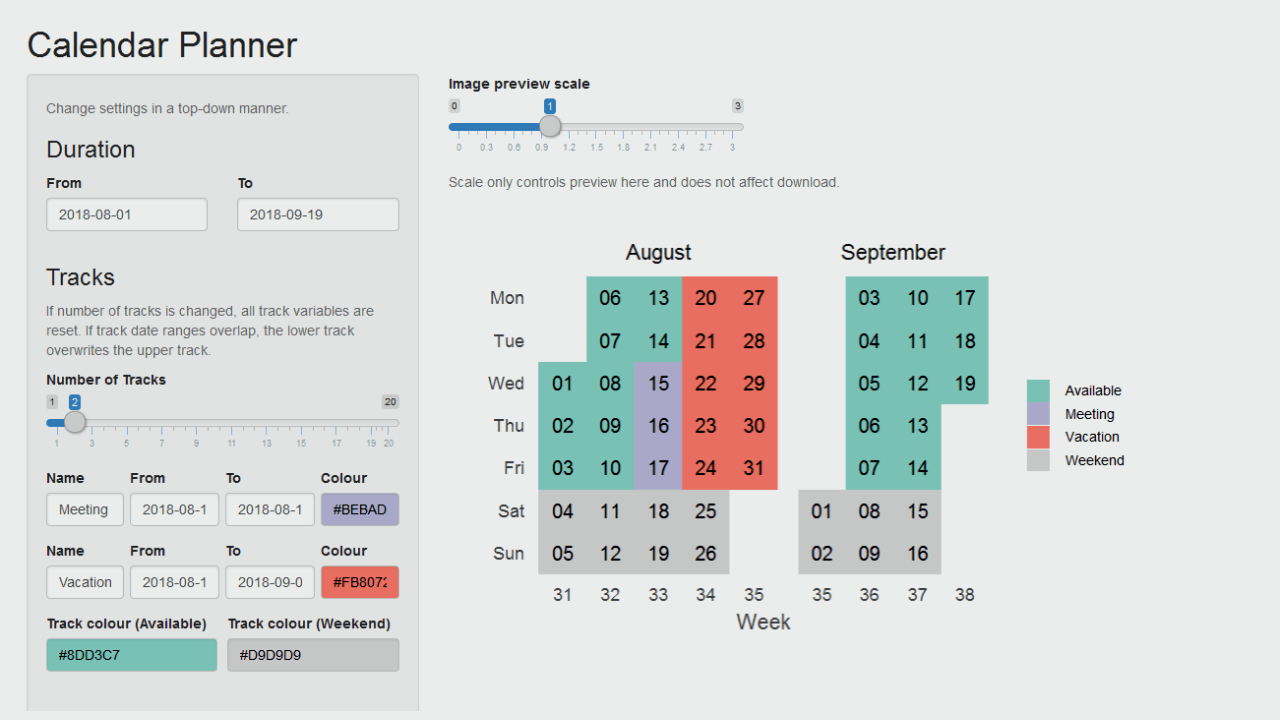
So I had my core plotting code from the previous post, and then I created user interfaces around it. The layout is simple; there is a panel on the left with input widgets and the panel on the right displays the plot. The app takes in user input for a date span (start and end duration) and a data.frame is created expanding that span to a sequence of dates.
I wanted the start date duration and end date duration widgets to be side-by-side in one row, and therefore, I have used custom divs. For date input, I have set the default start date to be today’s date and end date to be 30 days from today.
div(class="row",
    div(class="col-md-6", dateInput("in_duration_date_start", "From", value=format(as.Date(Sys.time(), "%Y-%m-%d", tz="Europe/Stockholm"), "%Y-%m-%d"))),
    div(class="col-md-6", dateInput("in_duration_date_end","To", value=format(as.Date(Sys.time(), "%Y-%m-%d", tz="Europe/Stockholm")+30, "%Y-%m-%d")))
)
Then the user adds more date spans to define various activities. I call these tracks. Rather than setting up a pre-defined number of tracks, I wanted to let the user choose the number of tracks. And each track will have some track parameters. I have defined a track name, start date, end date and a colour for the track. This called for a bit more complex code. The track inputs are dynamically created in a loop depending on the number of tracks set by the user.
The code that generates the track input user-interface (UI) dynamically looks like this:
output$tracks <- renderUI({
  num_tracks <- as.integer(input$in_num_tracks)

  # create date intervals
  dseq <- seq(as.Date(input$in_duration_date_start), as.Date(input$in_duration_date_end), by=1)
  r1 <- unique(as.character(cut(dseq, breaks=num_tracks+1)))

  lapply(1:num_tracks, function(i) {

    div(class="row",
        div(class="col-xs-3", style=list("padding-right: 3px;"), textInput(paste0("in_track_name_", i), label="Name", value=paste0("Text", i), placeholder="Available")),
        div(class="col-xs-3", style=list("padding-right: 3px; padding-left: 3px;"),  dateInput(paste0("in_track_date_start_", i), label="From", value=as.Date(r1[i], "%Y-%m-%d"))),
        div(class="col-xs-3", style=list("padding-right: 3px; padding-left: 3px;"), dateInput(paste0("in_track_date_end_", i), label="To", value=as.Date(r1[i+1], "%Y-%m-%d")-1)),
        div(class="col-xs-3", style=list("padding-left: 3px;"), colourpicker::colourInput(paste0("in_track_colour_", i), label="Colour", palette="limited", allowedCols=cols, value=cols[i]))
    )
  })
})
This looks like this in action:
Based on the number of input tracks, the date duration span is split into equal intervals by default. The start and end dates of the intervals are used as the default spans for track dates. Default colours are also selected by looping through a pre-defined colour vector.
A core function takes in all the plot related input to create the plot and returns a ggplot2 object. This function is called by the renderImage() function that creates the preview plot and also by the download plot handler. Inside the core function, a loop is also used to read the input track parameters back. The relevant part of the code looks like this:
num_tracks <- input$in_num_tracks
track_cols <- vector(length=num_tracks)
tracks <- vector(length=num_tracks)
for(i in 1:num_tracks)
{
  temp_start_date <- as.Date(as.character(eval(parse(text=paste0("input$in_track_date_start_", i)))))
  temp_end_date <- as.Date(as.character(eval(parse(text=paste0("input$in_track_date_end_", i)))))
  temp_track_name <- as.character(eval(parse(text=paste0("input$in_track_name_", i))))
  temp_track_col <- as.character(eval(parse(text=paste0("input$in_track_colour_", i))))
}
I have only focused on the exciting bit of code that is new to me. The full code is available at this GitHub repo. A demo of this app is available at this shinyapps.io link. This link may not always be active.


Comments