class: center, middle, inverse, title-slide # Quick intro to ggplot2 ### <b>Roy Francis</b> • 23-Sep-2021 ### <a href="https://royfrancis.github.io/course-r">https://royfrancis.github.io/course-r</a> ### <a href="mailto:roy.francis@nbis.se" class="email">roy.francis@nbis.se</a> --- exclude: true count: false <link href="https://fonts.googleapis.com/css?family=Roboto|Source+Sans+Pro:300,400,600|Ubuntu+Mono&subset=latin-ext" rel="stylesheet"> <link rel="stylesheet" href="https://use.fontawesome.com/releases/v5.3.1/css/all.css" integrity="sha384-mzrmE5qonljUremFsqc01SB46JvROS7bZs3IO2EmfFsd15uHvIt+Y8vEf7N7fWAU" crossorigin="anonymous"> --- name: gvb2 ## `ggplot2` vs Base Graphics .pull-left-50[ ```r plot(iris$Petal.Length,iris$Petal.Width, col=c("red","green","blue")[iris$Species], pch=c(0,1,2)[iris$Species]) legend(x=1,y=2.5, legend=c("setosa","versicolor","virginica"), pch=c(0,1,2),col=c("red","green","blue")) ``` <img src="ggplot_files/figure-html/unnamed-chunk-3-1.svg" style="display: block; margin: auto auto auto 0;" /> ] .pull-right-50[ ```r ggplot(iris,aes(Petal.Length,Sepal.Length,color=Species))+ geom_point() ``` <img src="ggplot_files/figure-html/unnamed-chunk-4-1.svg" style="display: block; margin: auto auto auto 0;" /> ] --- name: gog class: spaced ## Grammar Of Graphics .pull-left-30[ 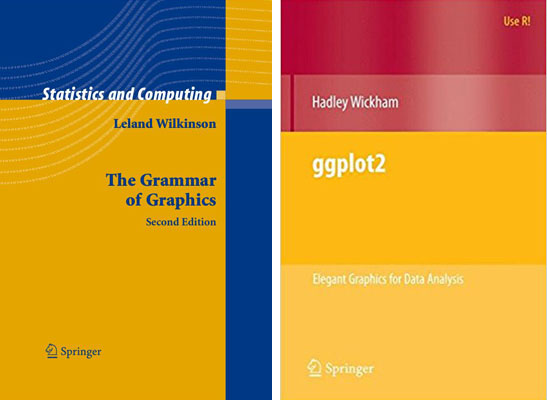 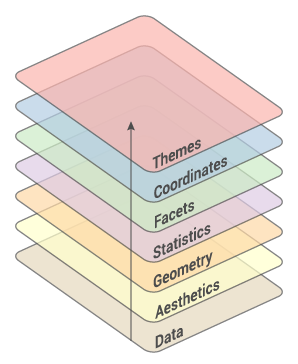 ] -- .pull-right-70[ * **Data**: Input data * **Geom**: A geometry representing data. Points, Lines etc * **Aesthetic**: Visual characteristics of the geometry. Size, Color, Shape etc * **Scale**: How visual characteristics are converted to display values * **Statistics**: Statistical transformations. Counts, Means etc * **Coordinates**: Numeric system to determine position of geometry. Cartesian, Polar etc * **Facets**: Split data into subsets ] ??? `ggplot` was created by Hadley Wickham in 2005 as an implementation of Leland Wilkinson's book Grammar of Graphics. Different graphs have always been considered as independent entities and also labelled differently such as barplots, scatterplots, boxplots etc. Each graph has it's own function and plotting strategy. Grammar of graphics (GOG) tries to unify all graphs under a common umbrella. GOG brings the idea that graphs are made up of discrete components which can be mixed and matched to create any plot. This creates a consistent underlying framework to graphing. --- name: syntax ## Building A Graph: Syntax 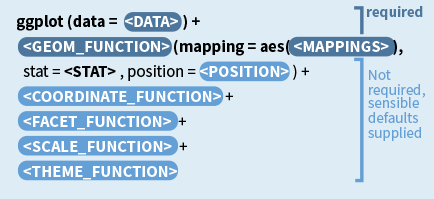 --- ## Initialise data .pull-left-45[ ```r library(ggplot2) ggplot(iris) ``` ] .pull-right-55[ <img src="ggplot_files/figure-html/unnamed-chunk-6-1.svg" style="display: block; margin: auto auto auto 0;" /> ] ??? Initialise with a dataframe. --- ## Map variables to axes .pull-left-45[ ```r ggplot(iris,aes(x=Sepal.Length, y=Sepal.Width)) ``` ] .pull-right-55[ <img src="ggplot_files/figure-html/unnamed-chunk-8-1.svg" style="display: block; margin: auto auto auto 0;" /> ] ??? Map variables to x and y axes. --- ## Set geometry .pull-left-45[ ```r ggplot(iris,aes(x=Sepal.Length, y=Sepal.Width))+ geom_point() ``` ] .pull-right-55[ <img src="ggplot_files/figure-html/unnamed-chunk-10-1.svg" style="display: block; margin: auto auto auto 0;" /> ] ??? Set geometry to be plotted. --- ## Map variable to colour .pull-left-45[ ```r ggplot(iris,aes(x=Sepal.Length, y=Sepal.Width, * colour=Species))+ geom_point() ``` ] .pull-right-55[ <img src="ggplot_files/figure-html/unnamed-chunk-12-1.svg" style="display: block; margin: auto auto auto 0;" /> ] ??? Map the colour of the points to a variable. --- ## Map variable to shape .pull-left-45[ ```r ggplot(iris,aes(x=Sepal.Length, y=Sepal.Width, colour=Species, * shape=Species))+ geom_point() ``` ] .pull-right-55[ <img src="ggplot_files/figure-html/unnamed-chunk-14-1.svg" style="display: block; margin: auto auto auto 0;" /> ] ??? Change shape of the points based on "Species" variable. --- ## Add more geometries .pull-left-45[ ```r ggplot(iris,aes(x=Sepal.Length, y=Sepal.Width, colour=Species, shape=Species))+ geom_point()+ * geom_smooth(method="lm") ``` ] .pull-right-55[ <img src="ggplot_files/figure-html/unnamed-chunk-16-1.svg" style="display: block; margin: auto auto auto 0;" /> ] ??? Add a regression line. --- ## Set custom colour scale .pull-left-45[ ```r ggplot(iris,aes(x=Sepal.Length, y=Sepal.Width, colour=Species, shape=Species))+ geom_point()+ geom_smooth(method="lm")+ * scale_colour_manual(values=c("#bebada","#fb8072","#8dd3c7")) ``` ] .pull-right-55[ <img src="ggplot_files/figure-html/unnamed-chunk-18-1.svg" style="display: block; margin: auto auto auto 0;" /> ] ??? Set your own colour scale. --- ## Subplots using facetting .pull-left-45[ ```r ggplot(iris,aes(x=Sepal.Length, y=Sepal.Width, colour=Species, shape=Species))+ geom_point()+ geom_smooth(method="lm")+ scale_colour_manual(values=c("#bebada","#fb8072","#8dd3c7"))+ * facet_wrap(~Species) ``` ] .pull-right-55[ <img src="ggplot_files/figure-html/unnamed-chunk-20-1.svg" style="display: block; margin: auto auto auto 0;" /> ] ??? Split your plot into sub plots. --- ## Set labels .pull-left-45[ ```r ggplot(iris,aes(x=Sepal.Length, y=Sepal.Width, colour=Species, shape=Species))+ geom_point()+ geom_smooth(method="lm")+ scale_colour_manual(values=c("#bebada","#fb8072","#8dd3c7"))+ facet_wrap(~Species)+ * labs(x="Sepal length",y="Sepal width", * title="Scatterplot of flower characteristics", * subtitle="Relationship between length and width of sepals.", * caption="Credit: iris dataset") ``` ] .pull-right-55[ <img src="ggplot_files/figure-html/unnamed-chunk-22-1.svg" style="display: block; margin: auto auto auto 0;" /> ] ??? Add axes labels, plot title, plot subtitle and caption. --- ## Change theme .pull-left-45[ ```r ggplot(iris,aes(x=Sepal.Length, y=Sepal.Width, colour=Species, shape=Species))+ geom_point()+ geom_smooth(method="lm")+ scale_colour_manual(values=c("#bebada","#fb8072","#8dd3c7"))+ facet_wrap(~Species)+ labs(x="Sepal length",y="Sepal width", title="Scatterplot of flower characteristics", subtitle="Relationship between length and width of sepals.", caption="Credit: iris dataset")+ * theme_bw() ``` ] .pull-right-55[ <img src="ggplot_files/figure-html/unnamed-chunk-24-1.svg" style="display: block; margin: auto auto auto 0;" /> ] ??? Change theme. --- ## Customise theme elements .pull-left-45[ ```r ggplot(iris,aes(x=Sepal.Length, y=Sepal.Width, colour=Species, shape=Species))+ geom_point()+ geom_smooth(method="lm")+ scale_colour_manual(values=c("#bebada","#fb8072","#8dd3c7"))+ facet_wrap(~Species)+ labs(x="Sepal length",y="Sepal width", title="Scatterplot of flower characteristics", subtitle="Relationship between length and width of sepals.", caption="Credit: iris dataset")+ theme_bw()+ * theme(legend.position="top", * plot.caption=element_text(hjust=0)) ``` ] .pull-right-55[ <img src="ggplot_files/figure-html/unnamed-chunk-26-1.svg" style="display: block; margin: auto auto auto 0;" /> ] ??? Customise theme elements. Legend is positioned on the top and credit text has been moved to the left. --- name: end-slide class: end-slide # Thank you! Questions? .end-text[ <p class="smaller"> <span class="small" style="line-height: 1.2;">Graphics from </span><img src="./assets/freepik.jpg" style="max-height:20px; vertical-align:middle;"><br> Created: 23-Sep-2021 • Roy Francis • <a href="https://www.scilifelab.se/">SciLifeLab</a> • <a href="https://nbis.se/">NBIS</a> </p> ]